A Lighter Touch: Exploring CPU Power Scaling On Core i9-13900K and Ryzen 9 7950X
by Gavin Bonshor on January 6, 2023 8:00 AM EST- Posted in
- CPUs
- AMD
- Intel
- 65W
- TDP
- Ryzen 9 7950X
- Core i9-13900K
- Power Scaling
- Efficiency
- 105W
- 125W
- 253W
- 230W
- PPT
Conclusion
So after lots of testing at various power levels on the Intel Core i9-13900K and the AMD Ryzen 9 7950X processors, we saw some very interesting results. While it's clearly established that both brands' current generation flagships are high-performance desktop goliaths in their own right, the performance of these processors doesn't scale down with power consumption in quite the same way. And that gives us some interesting results to dissect.
For our analysis, we've split our conclusion into two parts with a final summary; this allows us to make it more distinct in terms of benefits (if any), performance, and of course, if it's simply worth reducing the power on either the Core i9-13900K or Ryzen 9 7950X.
Core i9-13900K Power Scaling Summary
Starting with Intel's Core i9-13900K, we did experience some interesting results across the multitude of benchmarks and both games we tested. While the Core i9-13900K and Ryzen 9 7950X trade blows competitively when left at stock settings, Intel's offering didn't seem quite as performance competitive (and thus overall efficiency) at lower power envelopes.
Despite being the more power-hungry processor overall, albeit, with better heat transfer than AMD's offering as evidenced by CPU core temperatures, the Core i9-13900K didn't scale quite as effectively as we would have expected. Or, at least, it didn't retain its high performance quite as well at lower TDPs when placed opposite AMD's best chip.
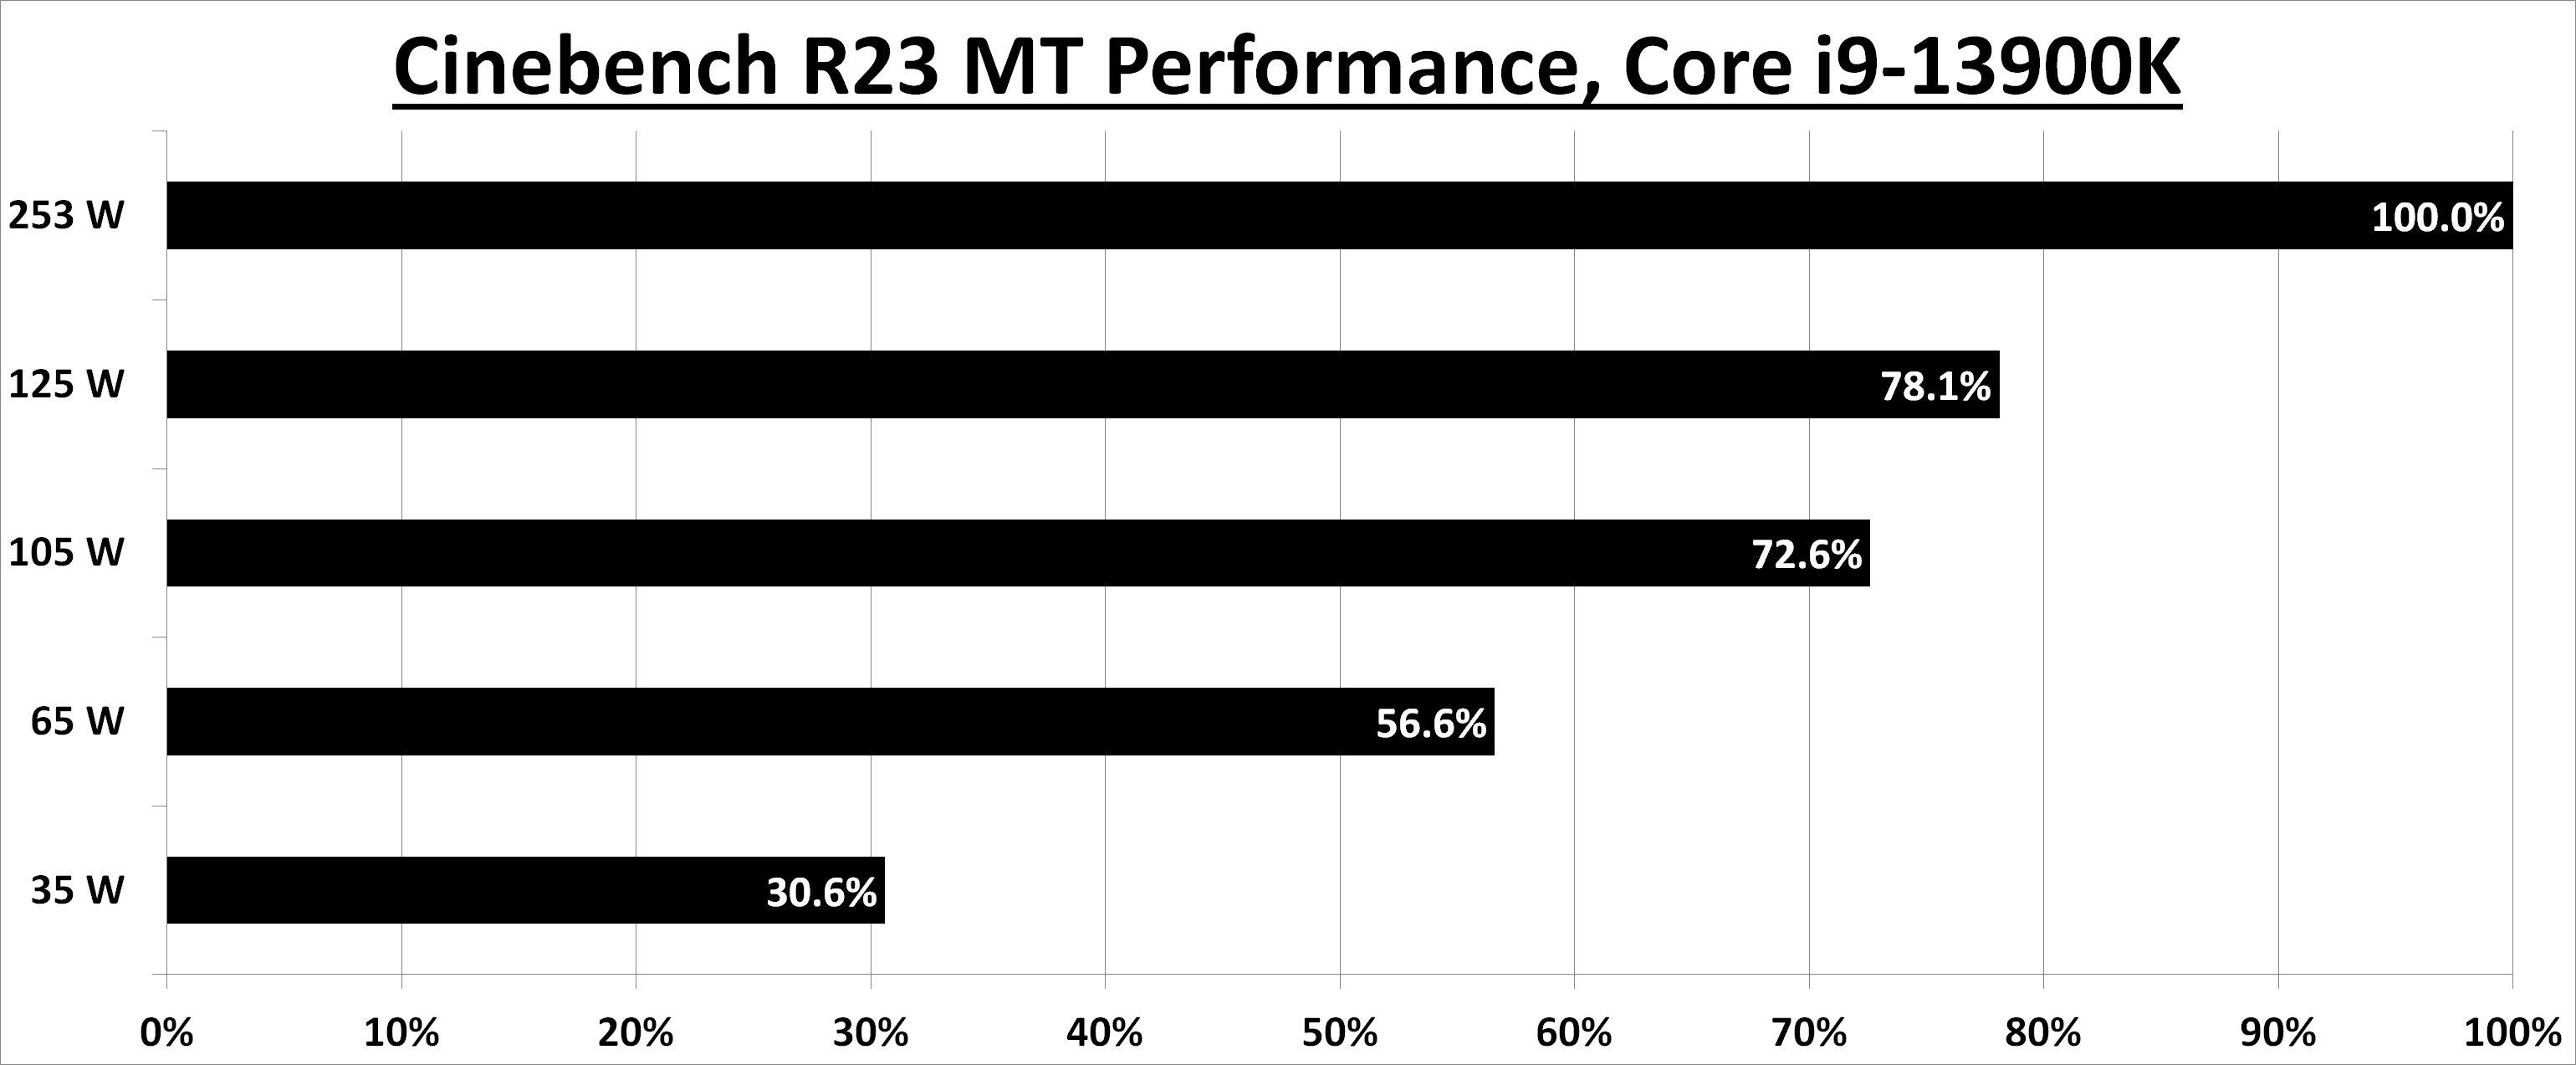
Using our CineBench R23 Multi-Thread test results as our baseline for compute performance, we can see how well the Core i9-13900K scales when tasked with rendering. Using the stock settings figure as our baseline at 100% performance, we can see that dropping down to 125 W; we saw performance sit at around 78%. As we dialed down the power to 105 W, which isn't a massive shift in power consumed, we got about 72% of the performance compared to stock.
Going down to the fan-favorite 65 W point, we saw performance levels drop to 56.6% of stock performance. Which, keeping in mind this is just 26% of the rated power consumption (and less still if the yCruncher power numbers fully translate here). So on a normalized basis, the energy efficiency of the i9-13900K has more than doubled (2.2x) when dialing it down to 65 Watts – it gives up a lot of performance, but it saves even more on power consumption. And if we do rope in those yCruncher measured power figures, then we're looking at something closer to 2.62x the power efficiency versus stock, primarily on account of the i9-13900K's incredibly high stock power consumption.
Overall, at the 65 W mark we saw a peak load power of 71.4 W, and a peak core temperature of 39°C.
In our gaming tests, the Core i9-13900K performed equally well at all of the power settings we tested, which shows that despite curtailing the power limits massively, the performance for gamers is still there; not all games are created equally, and I'm sure there will be games that may see some drops in performance. The only pitfall we saw with the Core i9-13900K in our game testing was some slightly lower 5% lows in frame rate performance, which has the potential to be concerning, but it's going to depend on the game and the minimum framerates desired (e.g. does it drop below the 60fps mark).
Ryzen 9 7950X Power Scaling Summary
Things get very interesting moving onto the AMD Ryzen 9 7950X processor and the Zen 4 core based on TSMC's 5 nm node. At the top end of the power spectrum at stock settings, the Ryzen 9 7950X shows more efficiency in terms of performance per watt than the Core i9-13900K. Still, we observed some fascinating results as we restricted the power to the AM5 socket through AMD's Package Power Tracking (PPT) technology.
The first thing I want to point out is that, going by yCruncher, the Ryzen 9 7950X uses around 34% less power at stock settings than the Core i9-13900K to achieve similar performance levels. So AMD is already starting from a better place in terms of power efficiency.
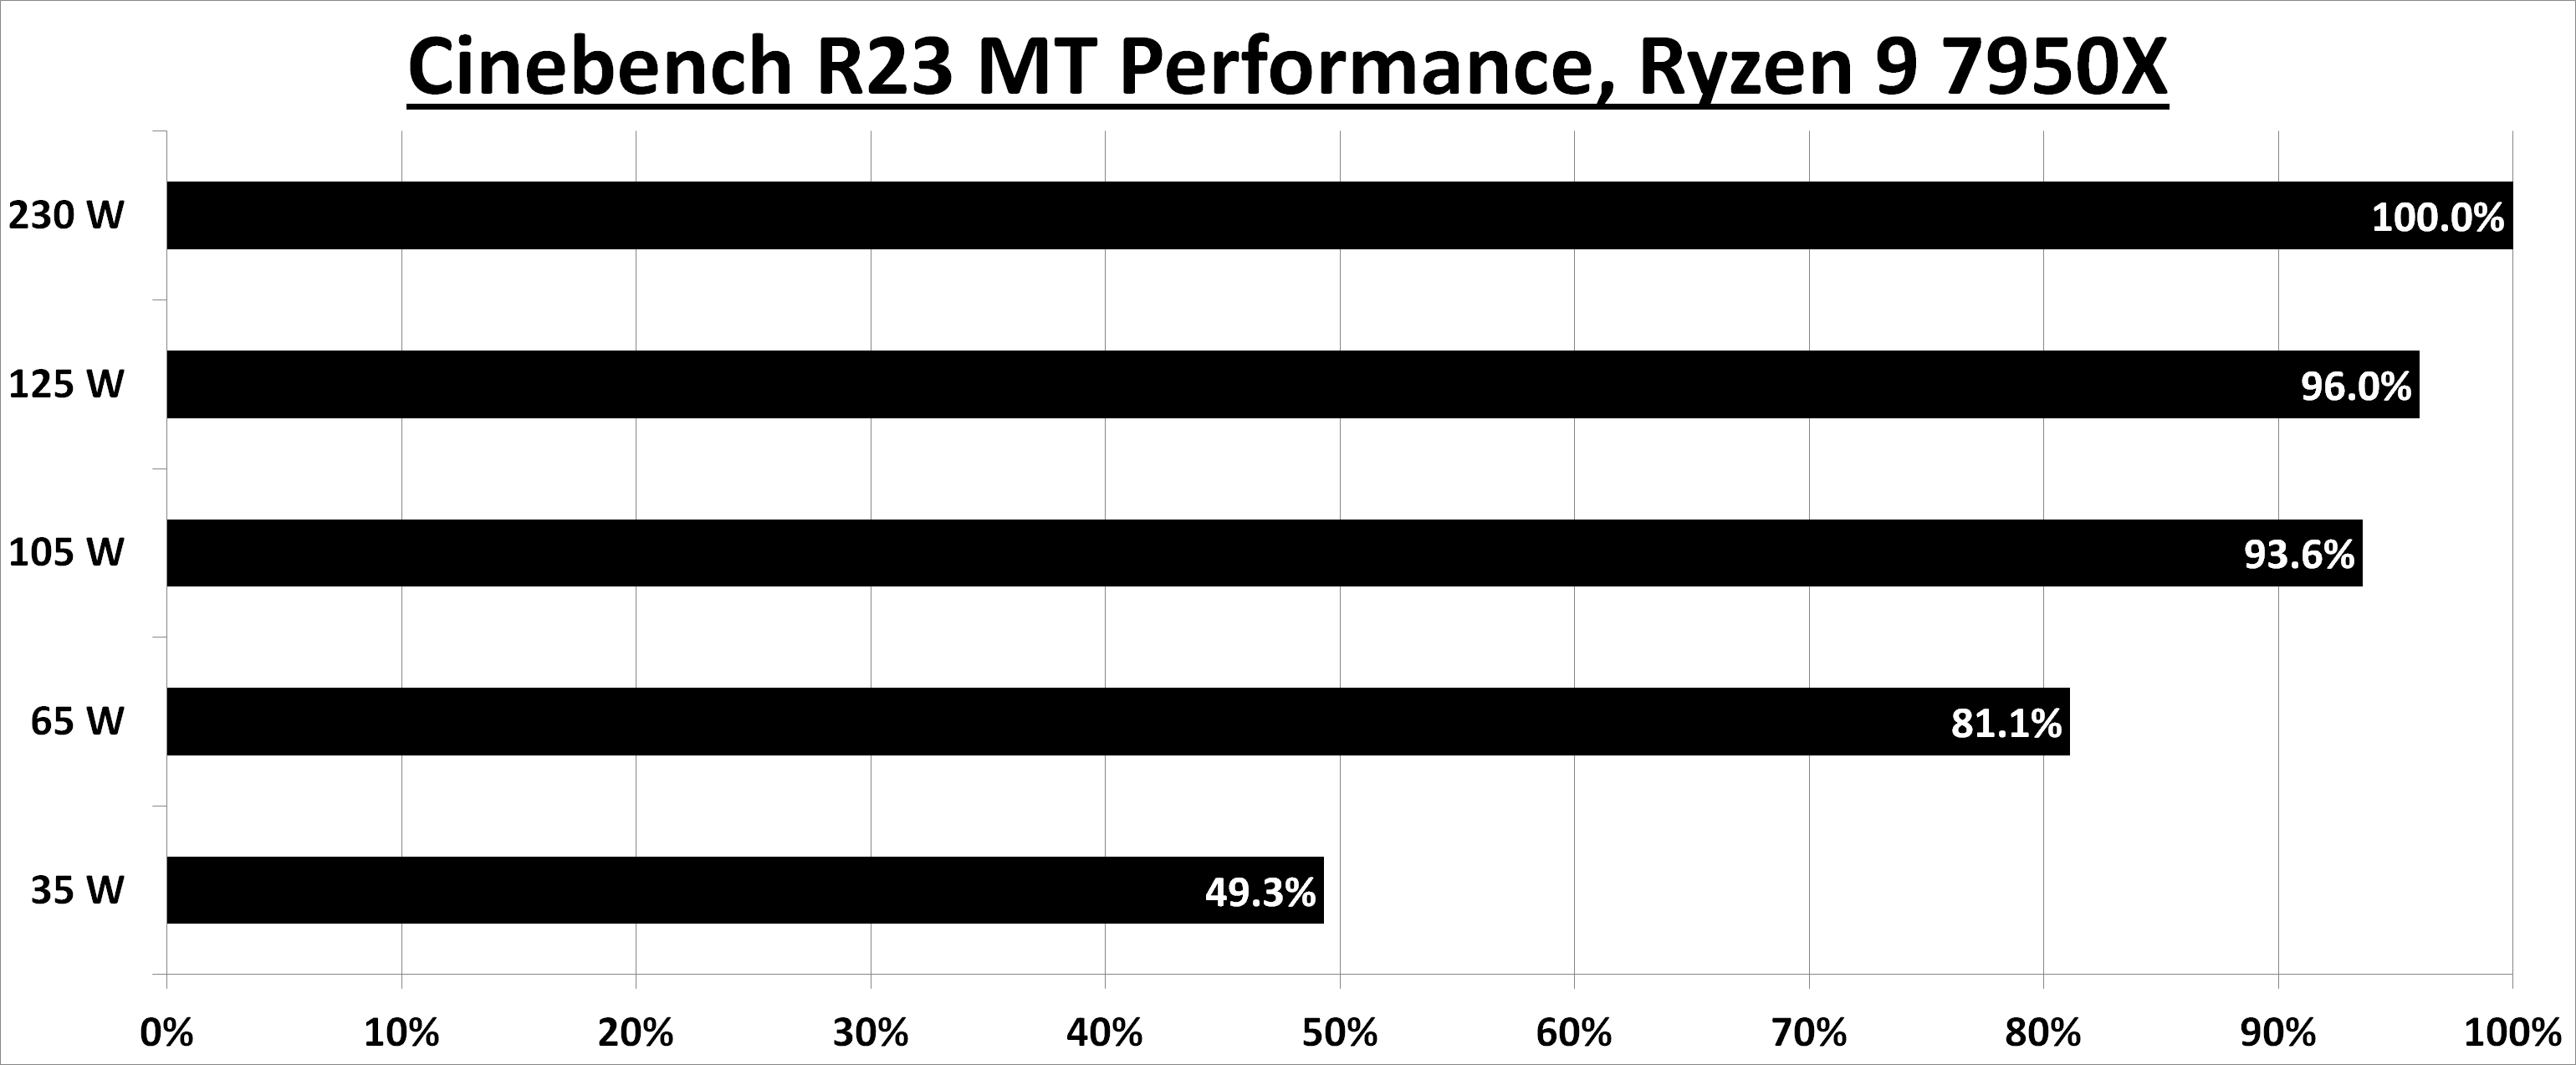
Looking at our results in CineBench R23 Multi-Threaded, the Ryzen 9 7950X scaled exceptionally well from a PPT of 230 W down to 65 W. The most important results are obtained at 65 W, with CineBench R23 MT showing that the Ryzen 9 7950X kept 81.1% of its performance in that benchmark's rendering workload when compared directly to stock performance, all with a PPT setting just 28% of the stock limit. So to put things on a normalized basis once again, AMD's power efficiency has almost trebled (2.87x), keeping a lot of performance for a sizable drop in power consumption.
The catch here, however, is that the AMD platform as a whole was far more lax in sticking to its programmed PPT values, as evidenced by yCruncher power consumption. Despite setting the 7950X to 65 W, we still measured 90.3 W under that workload. So on the assumption that translates to CineBench, the 7950X's power efficiency gains aren't as impressive; we're looking at 42% of the power consumption for 81.1% of the performance, or a power efficiency of 1.93x over stock.
Looking at the rest of the metrics at 65 W, we saw a peak load power of 90.3 W, and a peak core temperature of 52°C.
Finally, in the case of both processors, performance at 35 W wasn't precisely jaw-dropping, but it has to be noted that there are diminishing returns to any form of efficiency, and 35 W was, perhaps, a stretch too far for this much physical silicon. Despite this, the Ryzen 9 7590X held 49.3% of its performance in CineBench R23 MT, and the Core i9-13900K had just 30.6% of its performance at 35 W.
Reducing The 'TDP': Watts The Point
So when it comes to reducing TDP or restricting power to the CPU, some may ask, what's the point? Well, one example of where aiming for a higher-end processor and simply limiting power to it is in small form factor PCs. Smaller chassis typically have fewer cooling options available, and for the dinky systems, running a CPU at 253 W (13900K) or 230 W (7950X) can cause as many problems as it solves in such a tight space. Add any mid-range or high-level graphics card to the mix, and things will heat up quickly.
It's worth noting that a typical 240 mm AIO premium CPU cooler, such as Cooler Master's MasterLiquid Pro 240, can accommodate between 210 to 230 W of thermal power generated, so anything smaller that's ample for SFF computing is going to be even less effective in shifting heat from the CPU to the exterior of the chassis. It's even recommended by many that users look for premium cooling, such as a 240 mm or, ideally, a 360 mm AIO CPU cooler when using one of these flagship processors.
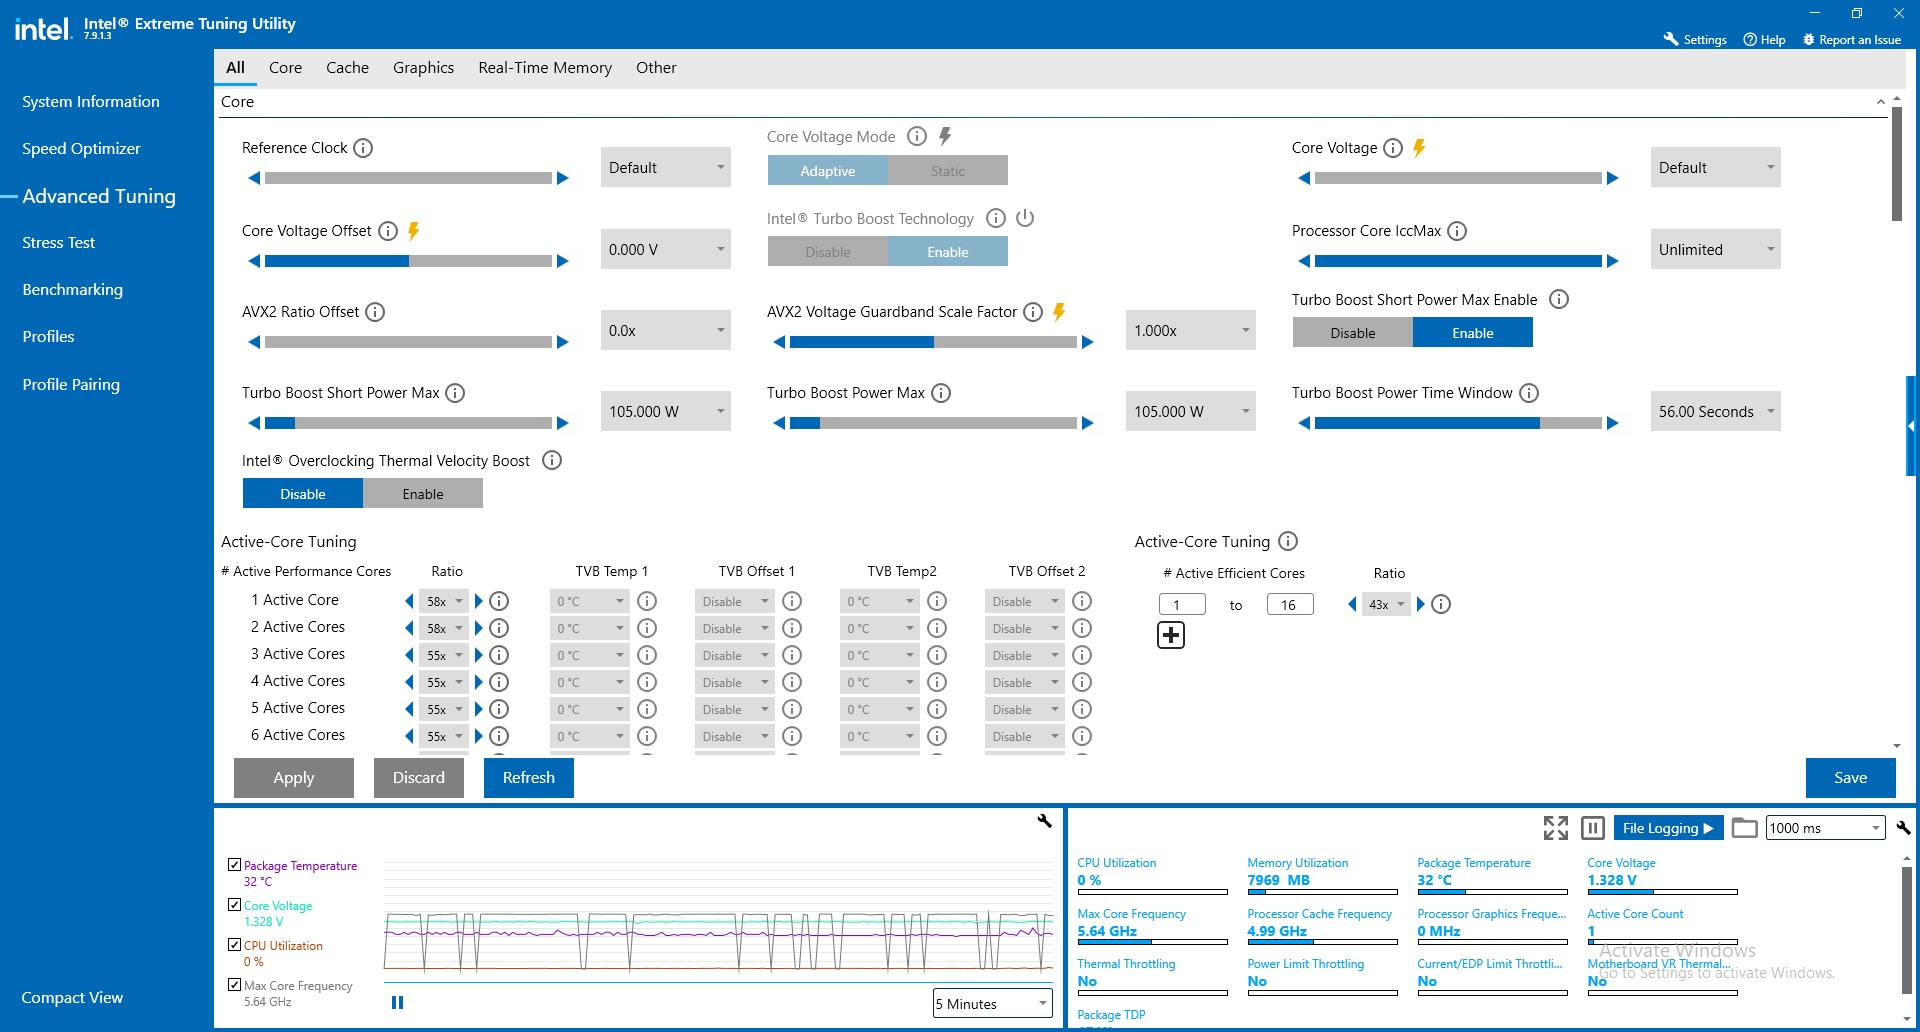
Screenshot from Intel's Xtreme Tuning Utility (XTU)
It's not just SFF enthusiasts who can benefit from lowering overall power consumption. Still, those who are conscious of how much energy they are using aren't going to look favorably on 300 W of power being spat out from the CPU on its own, especially if there's no alternative to dropping a small percentile of performance for a fraction of efficiency. Less heat + less power = less problems.
Final Words: Zen 4 is Very Efficient, But Everyone Improves With Lower TDPs
Despite more affordable options capable of delivering solid gaming performance (check out our latest Best CPUs for Gaming guide for more details), in regards to taking x86 computing to new heights, both Intel and AMD can be proud of their achievements. Our testing and our independent reviews of the AMD Ryzen 9 7950X and Intel Core i9-13900K processors are clear that both are the cream of the crop regarding high-performance desktop computing. In fact, at the top end of the spectrum, both processors trade blows in compute elements such as rendering, encoding, simulation, and gaming.
The biggest winner in our testing is AMD with the Ryzen 9 7950X. The biggest takeaway from our analysis is that despite curtailing the max power consumption on the Ryzen 9 7950X by over 50%, plenty of performance remains on the table to be tapped into. Seeing the chip retain 80%+ of its stock performance even when the peak power consumption is just 42% is a very encouraging outcome. This makes SFF computing more appealing, even at the higher end.
Intel's i9-13900K, in comparison, doesn't fare quite as well. Though as it's clear both platforms are running well outside their "sweet spots" on the v/f curve for these flagship SKUs, it still benefits as well: a 65 W setting still gives us around 60% of the performance for 21%(!) the measured peak power consumption. The end result is that the i9-13900K sheds more power consumption on both an absolute and relative basis than AMD's chip, giving up more performance in the process.
Just keep in mind that TDPs (and PPTs) are better thought of as an "aspirational" value than a hard limit. That goes for both stock settings, and when power limiting these chips. In the end, neither platform quite adhered to our desired power limits, with AMD's being the worse of the two. Meaning that outside of stock settings, the 7950X ended up consuming more power at any given limit. But in keeping with our desire to focus on real-world performance here, this still offers a very valid take on what to expect from dialing either processor down to "65" Watts, as I doubt very many tweakers are targeting a specific wattage, versus just dialing down their power limits to save power and boost efficiency.
Ultimately, if you're short of space right now, you can still benefit from lower temperatures and reduced power consumption with either platform. Though when it comes to overall (i.e. best) performance, the edge goes to the Ryzen 9 7950X. With a nearly 2x increase in energy efficiency shifting down to a 65 Watt(ish) PPT setting, it's clear that the chip was pushed well past its sweet spot in order to achieve the best possible absolute performance. All of which means there's a lot of energy efficiency to gain from pulling it back to that spot. No wonder AMD decided now was the time to bring one of its chiplet-based desktop CPUs to the mobile arena with the new Ryzen Mobile 7045 HX-series processors – as audacious as a 16 core CPU is in a laptop, AMD's Zen 4 silicon is up to the task.


61 Comments
View All Comments
ingwe - Friday, January 6, 2023 - link
Really cool testing. If I had an 7950, I wouldn't be running it higher than 105W. Then again, I have a 5600 and I am running that at 45 W. Feels like the gains these days aren't generally worth the power (for my use cases and especially for AMD). I am surprised by how well Intel's performance scales with power. I would be curious how 12th gen looks since this isn't their first gen with high power consumption they may have done a lot better designing for power scaling.deksman2 - Friday, January 6, 2023 - link
Yeah. I think AMD's sweet spot for Zen 4 should have remained 105W like last gen.They could have introduced 170W for a bit of extra performance... but otherwise make a statement that there was too much in diminishing returns.
7900x and 7950x should probably be run at 105W by default... you get 6.4% less performance at nearly 50% lower power draw (vs 170W), and generally, lower temps.
fybyfyby - Saturday, January 7, 2023 - link
They needed 170/230 target only for compete with Intel. Otherwise it doesn't make sense. I tried all eco modes and I'm perfectly fine with 65w. 105w is identical as my former 5900x wattage - in reality it is peaked around 145w. They needed to max out stock settings, but there is no need to use that for any ordinary user.DanNeely - Monday, January 9, 2023 - link
I'm really disappointed with Intel, AMD, NVidia, and AMD (again); all their current generation products are dragging high end overclocking power levels and resultingly terrible power efficiency into stock performance packages.Hulk - Friday, January 6, 2023 - link
I think you need to include at least one power level between 125W and 230W. That's quite a spread there that has no data that might change your conclusions had you included say 170W and 200W in the data.Also outside of benchmarks many real world applications don't saturate the individual cores enough to demand a lot of power. In these cases performances is more about how high the lightly loaded cores will scale rather than power limiting performance. This is exactly what you saw with the gaming tests and is why real world workloads should have been made before making conclusions.
But then again I'm almost afraid to criticize because I appreciate any new content on Anandtech these days!
repoman27 - Friday, January 6, 2023 - link
"I appreciate any new content on Anandtech these days!"—Amen to that.While I agree that the sampling points chosen make it more difficult to visualize the curve, it clearly starts to bend significantly between 65 and 105 W and has flattened out substantially by the time you hit 125 W. So personally, I'd be much more interested in seeing performance at 80 and 95 W instead, as the best power / performance trade-off is probably somewhere around there. Which, not coincidentally, is also where desktop CPU TDPs traditionally were, before Intel ran into process issues.
@gavbon, peak power is really not relevant to either TDP or power efficiency. And given their myriad differences, comparing temperatures as reported by these two CPUs seems unlikely to yield any meaningful takeaways. I'm not sure how Andrei used to do it, but running SPEC CPU 2017 (a fixed workload) while measuring the energy usage in Joules is pretty much the holy grail as far as efficiency is concerned.
Hresna - Tuesday, January 17, 2023 - link
I agree it would be great to see the curve - I was inspired to plot it myself for 13900k.https://www.reddit.com/r/hardware/comments/10bna5r...
This is essential coverage though, great to see Anandtech adopting this. I would love to see detailed power curves become standard for desktop chips going forward. If I had a 7950x to play with, it would be amazing to have both curves not he same chart. The inflexion points in the bend are sensitive so I might need to make some inferences but could use the Anandtech data as a starting point.
edzieba - Friday, January 6, 2023 - link
It would be interesting to plot benchmark performance vs. /actual/ power consumption rather than /reported/ consumption, as the Y-cruncher results on the last page show that the Ryzen chips are significantly underreporting power consumption vs. Intel (with the 105W capped Ryzen pulling the same power as the 125W-capped Intel). A scatterplot of normalised-per-benchmark scoring vs. measured power should result in a trend per CPU illustrating power scaling behaviour for different workloads.repoman27 - Friday, January 6, 2023 - link
The yCruncher chart shows peak power, which tells us essentially nothing about power consumption. If we knew the average power and duration of the test, we could infer energy usage. Peak power only gives us the magnitude of the largest recorded current spike during the test.Gavin Bonshor - Friday, January 6, 2023 - link
You are not wrong, if I get time over the weekend, I'll add some additional graphs profiling the power usage over one or two of the runs.