A Lighter Touch: Exploring CPU Power Scaling On Core i9-13900K and Ryzen 9 7950X
by Gavin Bonshor on January 6, 2023 8:00 AM EST- Posted in
- CPUs
- AMD
- Intel
- 65W
- TDP
- Ryzen 9 7950X
- Core i9-13900K
- Power Scaling
- Efficiency
- 105W
- 125W
- 253W
- 230W
- PPT
Core i9-13900K & Ryzen 9 7950X Scaling Performance: Peak Power/Temps & Gaming
In our gaming performance testing, we're using two very different titles to measure any gains (if any) when dropping the power on the Core i9-13900K and Ryzen 9 7950X. The first title is Total War: Warhammer 3, which is notoriously hungry in terms of processor performance. We felt this would be a good measuring stick to see how performance stands as we restrict power to the processor. The second title is Borderlands 3, which albeit more graphically intensive than TW: Warhammer 3, still benefits from processing power as many other titles do.
We'll first go over the peak package power and core temperatures.
Peak Power and Core Temperature: Feat yCruncher and AIDA64
One of the main benefits of reducing power consumption and electrical load on a component is temperature; less power means less heat. As we reduce the TDP and test with power restrictions, we should also see a noticeable reduction in heat and CPU core temperatures. To measure the peak package power load from the CPU and to determine the peak core temperatures, we are using AIDA64 to record both variables. Putting full load on the CPU is yCruncher, which we use to measure peak processor package power in our CPU reviews.
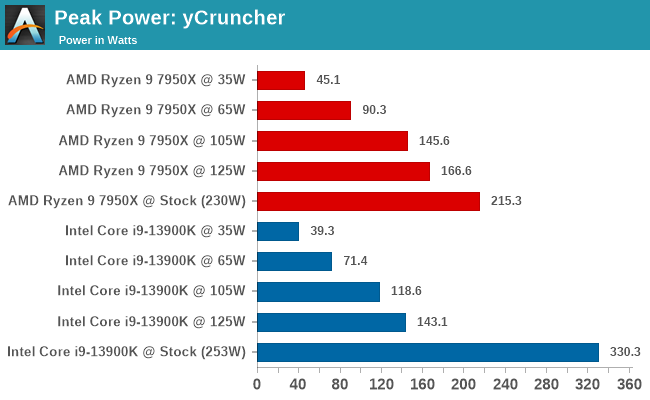
Starting with the peak power figures, it's worth noting that AMD's figures can be wide off the mark even when restricting the Package Power Tracking (PPT) in the firmware. For example, restricting the socket and 7950X to 125 W yielded a measured power consumption that was still a whopping 33% higher. By comparison, the 13900K exceeded its set limits by around 14% under full load. In all cases though, this is still a significant power reduction versus their stock settings, especially in the case of the power-hungry i9-13900K.
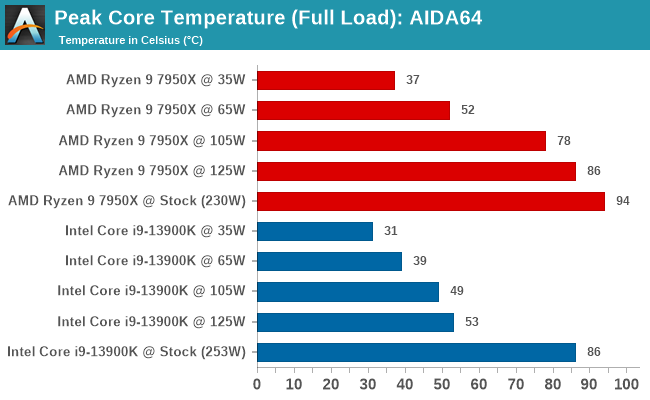
Following on from the temperatures, despite pulling a figure of 330.3 W under full load, the peak core temperature of the i9-1300K was 8°C lower than the Ryzen 9 7950X, which hit 94°C under full load. Given that the power figures given aligned more with the settings on the 13900K than they did on the 7950X, the drop in temperatures on the Intel processor was much better received, with 53°C at 125 W and just 39°C at 65 W.
There's certainly more performance at 65 W from our compute testing on the Ryzen 9 7950X, but it's drawing more power than it should be. It's also running hotter despite using a premium 360mm AIO CPU cooler, which is more than enough even at full load. As a reference, the room that all the testing was done at ranged between 22 and 24°C, so this shouldn't impact any of our thermal results too much.
Total War: Warhammer 3: 1080p Ultra and 4K Medium Settings
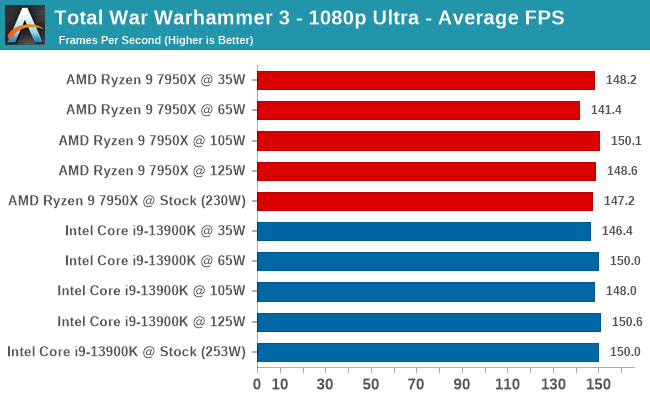

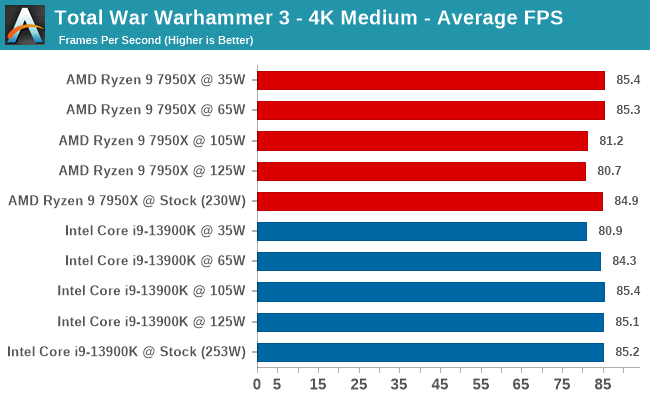
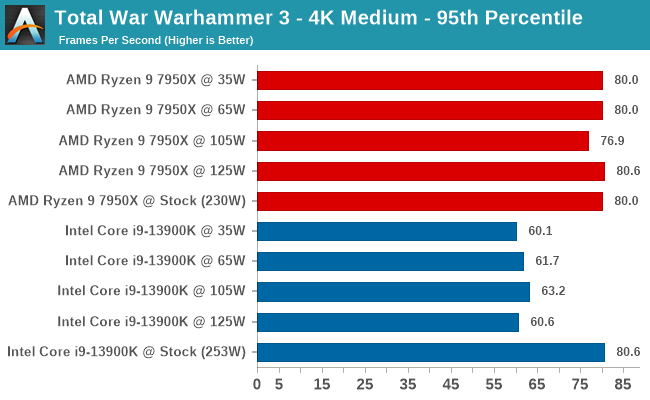
In Total War: Warhammer 3, we saw something very interesting. Dropping the power on the AMD Ryzen 9 7950X, even down to just 35 W, didn't seem to impact performance at either 1080p Ultra or 4K Medium settings. In both cases we're performance-bound by other factors, be it single-threaded performance or GPU performance. This is a good precedent being set here by AMD, as even at such a low power, it's not enough to warrant noticeable drops in framerates, which is partly down to utilization with our AMD Radeon RX 6960 XT graphics card.
Touching on the Intel Core i9-13900K, although average frame rates and 5% lows at 1080p remained stable and similar, the 5% lows were much less desirable when testing at 4K. Average frame rates seem stable, but having much lower 95th percentile frames could become troublesome depending on the title, visual settings, and utilization of both CPU and GPU at lower power. Though, like many benchmarks relating to games, this phenomena is going to vary on a game-by-game basis.
Borderlands 3: 1080p and 4K Ultra Settings
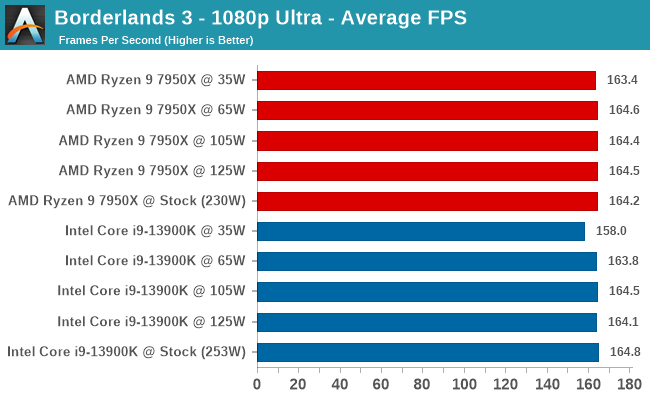
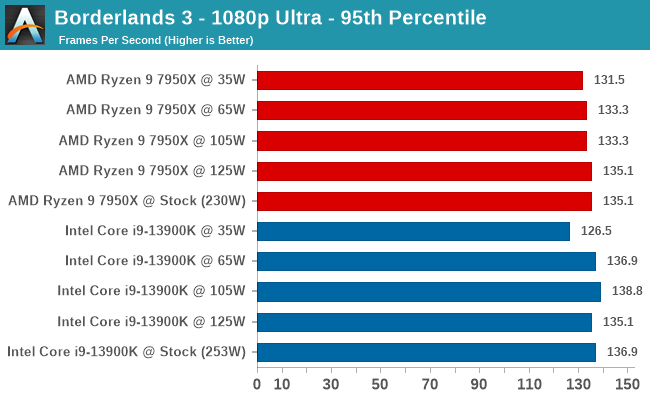
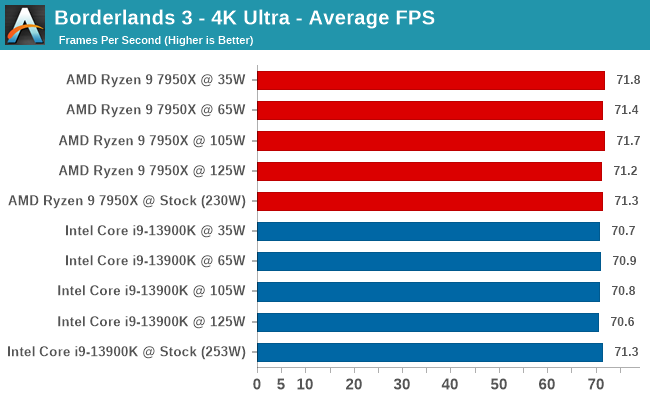
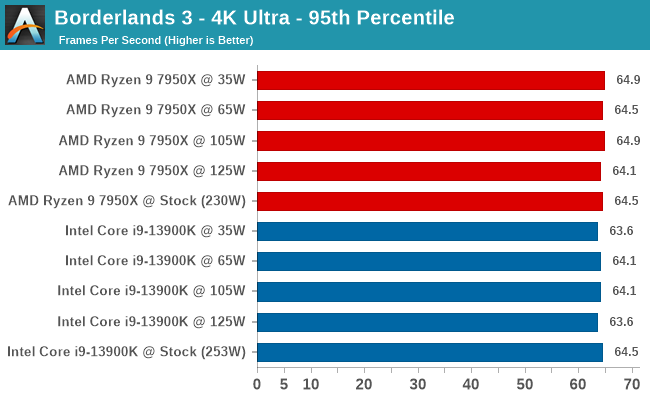
Looking at performance in Borderlands 3, we can see that both the Core i9-13900K and Ryzen 9 7950X perform well even at just 35 W. This shows how powerful both these chips are for gaming, with high core counts which, despite operating at much lower power than stock, that it doesn't affect performance too much.
The only real notable result in Borderlands 3 was the Intel Core i9-13900K at 1080p, with lower 5% low framerates than the Ryzen 9 7950X. Although this could be an anomaly, we tested this three times, and all the results were similar. Even so, at just 35 W, the performance in gaming was typically unaffected, which shows that the game is more often waiting on our Radeon RX 6950XT video card.
Of course, gaming performance isn't going to be too much of a war of attrition to seek benefits even at lower power envelopes on the processor at resolutions such as 1440p and 4K, where performance is primarily GPU-limited. Even at 1080p, where there's a cross-over between CPU and GPU utilization, performance is still good.
There will certainly be a big difference at lower resolutions, such as 720p and lower. Still, users looking at a $500-600 processor, a $300-500 motherboard, and $150+ for memory are highly unlikely to be gaming at these resolutions, so we focused more on the realistic scenarios in gaming as opposed to purely synthetic ones.


61 Comments
View All Comments
ingwe - Friday, January 6, 2023 - link
Really cool testing. If I had an 7950, I wouldn't be running it higher than 105W. Then again, I have a 5600 and I am running that at 45 W. Feels like the gains these days aren't generally worth the power (for my use cases and especially for AMD). I am surprised by how well Intel's performance scales with power. I would be curious how 12th gen looks since this isn't their first gen with high power consumption they may have done a lot better designing for power scaling.deksman2 - Friday, January 6, 2023 - link
Yeah. I think AMD's sweet spot for Zen 4 should have remained 105W like last gen.They could have introduced 170W for a bit of extra performance... but otherwise make a statement that there was too much in diminishing returns.
7900x and 7950x should probably be run at 105W by default... you get 6.4% less performance at nearly 50% lower power draw (vs 170W), and generally, lower temps.
fybyfyby - Saturday, January 7, 2023 - link
They needed 170/230 target only for compete with Intel. Otherwise it doesn't make sense. I tried all eco modes and I'm perfectly fine with 65w. 105w is identical as my former 5900x wattage - in reality it is peaked around 145w. They needed to max out stock settings, but there is no need to use that for any ordinary user.DanNeely - Monday, January 9, 2023 - link
I'm really disappointed with Intel, AMD, NVidia, and AMD (again); all their current generation products are dragging high end overclocking power levels and resultingly terrible power efficiency into stock performance packages.Hulk - Friday, January 6, 2023 - link
I think you need to include at least one power level between 125W and 230W. That's quite a spread there that has no data that might change your conclusions had you included say 170W and 200W in the data.Also outside of benchmarks many real world applications don't saturate the individual cores enough to demand a lot of power. In these cases performances is more about how high the lightly loaded cores will scale rather than power limiting performance. This is exactly what you saw with the gaming tests and is why real world workloads should have been made before making conclusions.
But then again I'm almost afraid to criticize because I appreciate any new content on Anandtech these days!
repoman27 - Friday, January 6, 2023 - link
"I appreciate any new content on Anandtech these days!"—Amen to that.While I agree that the sampling points chosen make it more difficult to visualize the curve, it clearly starts to bend significantly between 65 and 105 W and has flattened out substantially by the time you hit 125 W. So personally, I'd be much more interested in seeing performance at 80 and 95 W instead, as the best power / performance trade-off is probably somewhere around there. Which, not coincidentally, is also where desktop CPU TDPs traditionally were, before Intel ran into process issues.
@gavbon, peak power is really not relevant to either TDP or power efficiency. And given their myriad differences, comparing temperatures as reported by these two CPUs seems unlikely to yield any meaningful takeaways. I'm not sure how Andrei used to do it, but running SPEC CPU 2017 (a fixed workload) while measuring the energy usage in Joules is pretty much the holy grail as far as efficiency is concerned.
Hresna - Tuesday, January 17, 2023 - link
I agree it would be great to see the curve - I was inspired to plot it myself for 13900k.https://www.reddit.com/r/hardware/comments/10bna5r...
This is essential coverage though, great to see Anandtech adopting this. I would love to see detailed power curves become standard for desktop chips going forward. If I had a 7950x to play with, it would be amazing to have both curves not he same chart. The inflexion points in the bend are sensitive so I might need to make some inferences but could use the Anandtech data as a starting point.
edzieba - Friday, January 6, 2023 - link
It would be interesting to plot benchmark performance vs. /actual/ power consumption rather than /reported/ consumption, as the Y-cruncher results on the last page show that the Ryzen chips are significantly underreporting power consumption vs. Intel (with the 105W capped Ryzen pulling the same power as the 125W-capped Intel). A scatterplot of normalised-per-benchmark scoring vs. measured power should result in a trend per CPU illustrating power scaling behaviour for different workloads.repoman27 - Friday, January 6, 2023 - link
The yCruncher chart shows peak power, which tells us essentially nothing about power consumption. If we knew the average power and duration of the test, we could infer energy usage. Peak power only gives us the magnitude of the largest recorded current spike during the test.Gavin Bonshor - Friday, January 6, 2023 - link
You are not wrong, if I get time over the weekend, I'll add some additional graphs profiling the power usage over one or two of the runs.