Intel Pentium 4 6xx and 3.73EE: Favoring Features Over Performance
by Anand Lal Shimpi & Derek Wilson on February 21, 2005 6:15 AM EST- Posted in
- CPUs
Workstation Applications
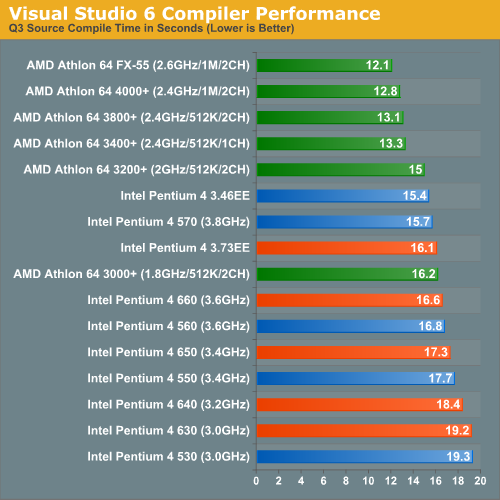
Visual Studio 6
Carried over from our previous CPU reviews, we continue to use Visual Studio 6 for a quick compile test. We are still using the Quake 3 source code as our test and measure compile time in seconds. The results are pretty much in line with what we've seen in the past.
SPECviewperf 8
For our next set of professional application benchmarks we turn to SPECviewperf 8. SPECviewperf is a collection of application traces taken from some of the most popular professional applications, and compiled together in a single set of benchmarks used to estimate performance in the various applications the benchmark is used to model. With version 8, SPEC has significantly improved the quality of the benchmark, making it even more of a real world indicator of performance.
We have included SPEC's official description of each one of the 8 tests in the suite.
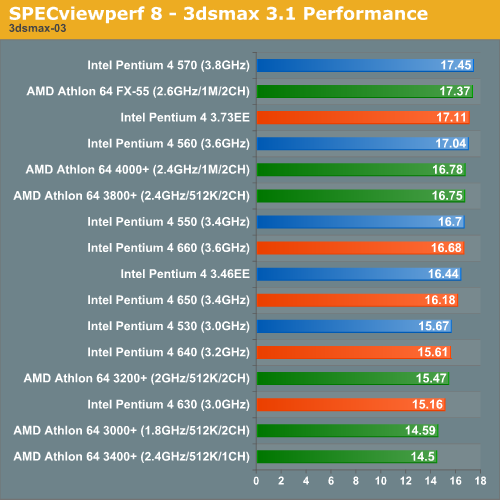
3dsmax Viewset (3dsmax-03)
"The 3dsmax-03 viewset was created from traces of the graphics workload generated by 3ds max 3.1. To insure a common comparison point, the OpenGL plug-in driver from Discreet was used during tracing.
The models for this viewset came from the SPECapc 3ds max 3.1 benchmark. Each model was measured with two different lighting models to reflect a range of potential 3ds max users. The high-complexity model uses five to seven positional lights as defined by the SPECapc benchmark and reflects how a high-end user would work with 3ds max. The medium-complexity lighting models uses two positional lights, a more common lighting environment.
The viewset is based on a trace of the running application and includes all the state changes found during normal 3ds max operation. Immediate-mode OpenGL calls are used to transfer data to the graphics subsystem."
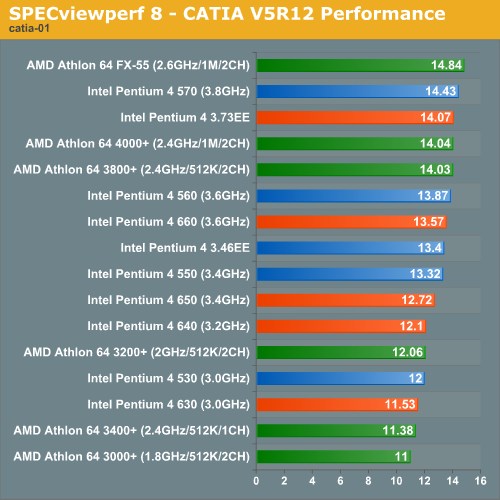
CATIA Viewset (catia-01)
"The catia-01 viewset was created from traces of the graphics workload generated by the CATIATM V5R12 application from Dassault Systems.
Three models are measured using various modes in CATIA. Phil Harris of LionHeart Solutions, developer of CATBench2003, supplied SPEC/GPC with the models used to measure the CATIA application. The models are courtesy of CATBench2003 and CATIA Community.The car model contains more than two million points. SPECviewperf replicates the geometry represented by the smaller engine block and submarine models to increase complexity and decrease frame rates. After replication, these models contain 1.2 million vertices (engine block) and 1.8 million vertices (submarine).
State changes as made by the application are included throughout the rendering of the model, including matrix, material, light and line-stipple changes. All state changes are derived from a trace of the running application. The state changes put considerably more stress on graphics subsystems than the simple geometry dumps found in older SPECviewperf viewsets.
Mirroring the application, draw arrays are used for some tests and immediate mode used for others."
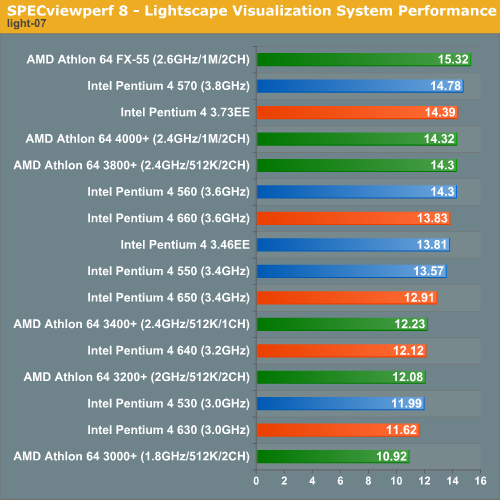
Lightscape Viewset (light-07)
"The light-07 viewset was created from traces of the graphics workload generated by the Lightscape Visualization System from Discreet Logic. Lightscape combines proprietary radiosity algorithms with a physically based lighting interface.
The most significant feature of Lightscape is its ability to accurately simulate global illumination effects by precalculating the diffuse energy distribution in an environment and storing the lighting distribution as part of the 3D model. The resulting lighting "mesh" can then be rapidly displayed."
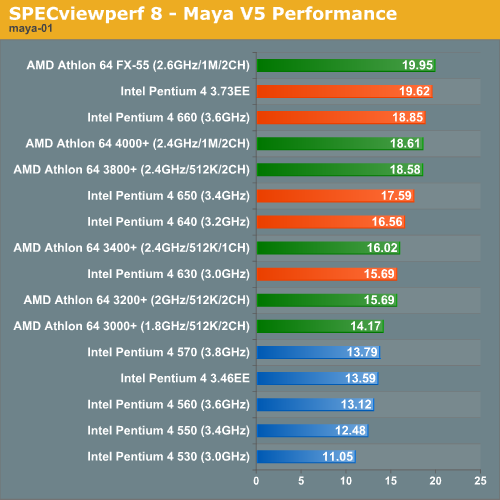
Maya Viewset (maya-01)
"The maya-01 viewset was created from traces of the graphics workload generated by the Maya V5 application from Alias.
The models used in the tests were contributed by artists at NVIDIA. Various modes in the Maya application are measured.
State changes as made by the application are included throughout the rendering of the model, including matrix, material, light and line-stipple changes. All state changes are derived from a trace of the running application. The state changes put considerably more stress on graphics subsystems than the simple geometry dumps found in older viewsets.
As in the Maya V5 application, array element is used to transfer data through the OpenGL API."
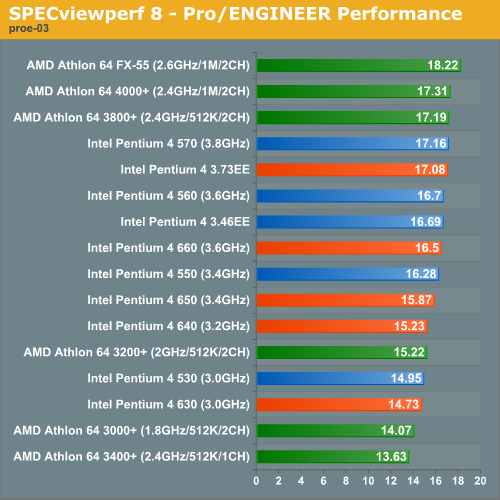
Pro/ENGINEER (proe-03)
"The proe-03 viewset was created from traces of the graphics workload generated by the Pro/ENGINEER 2001TM application from PTC.
Two models and three rendering modes are measured during the test. PTC contributed the models to SPEC for use in measurement of the Pro/ENGINEER application. The first of the models, the PTC World Car, represents a large-model workload composed of 3.9 to 5.9 million vertices. This model is measured in shaded, hidden-line removal, and wireframe modes. The wireframe workloads are measured both in normal and antialiased mode. The second model is a copier. It is a medium-sized model made up of 485,000 to 1.6 million vertices. Shaded and hidden-line-removal modes were measured for this model.
This viewset includes state changes as made by the application throughout the rendering of the model, including matrix, material, light and line-stipple changes. The PTC World Car shaded frames include more than 100MB of state and vertex information per frame. All state changes are derived from a trace of the running application. The state changes put considerably more stress on graphics subsystems than the simple geometry dumps found in older viewsets.
Mirroring the application, draw arrays are used for the shaded tests and immediate mode is used for the wireframe. The gradient background used by the Pro/E application is also included to better model the application workload."
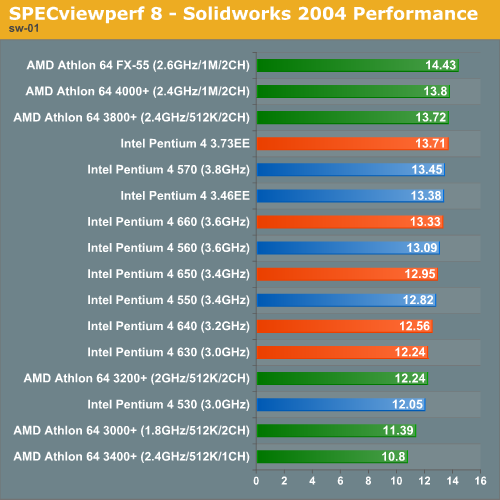
SolidWorks Viewset (sw-01)
"The sw-01 viewset was created from traces of the graphics workload generated by the Solidworks 2004 application from Dassault Systemes.
The model and workloads used were contributed by Solidworks as part of the SPECapc for SolidWorks 2004 benchmark.
State changes as made by the application are included throughout the rendering of the model, including matrix, material, light and line-stipple changes. All state changes are derived from a trace of the running application. The state changes put considerably more stress on graphics subsystems than the simple geometry dumps found in older viewsets.
Mirroring the application, draw arrays are used for some tests and immediate mode used for others."
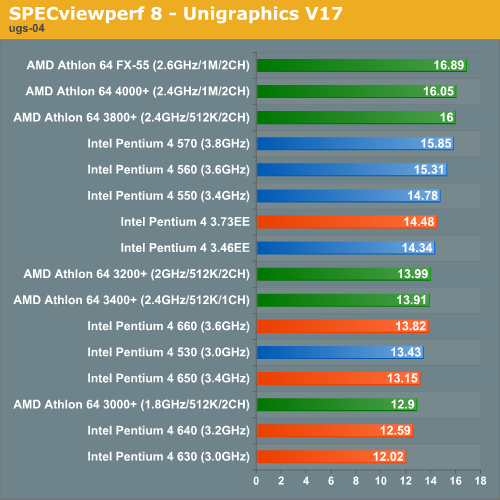
Unigraphics (ugs-04)
"The ugs-04 viewset was created from traces of the graphics workload generated by Unigraphics V17.
The engine model used was taken from the SPECapc for Unigraphics V17 application benchmark. Three rendering modes are measured -- shaded, shaded with transparency, and wireframe. The wireframe workloads are measured both in normal and anti-alised mode. All tests are repeated twice, rotating once in the center of the screen and then moving about the frame to measure clipping performance.
The viewset is based on a trace of the running application and includes all the state changes found during normal Unigraphics operation. As with the application, OpenGL display lists are used to transfer data to the graphics subsystem. Thousands of display lists of varying sizes go into generating each frame of the model.
To increase model size and complexity, SPECviewperf 8.0 replicates the model two times more than the previous ugs-03 test."


71 Comments
View All Comments
Alfaneo - Friday, August 26, 2005 - link
here is 478 pin result
Run All Summary
---------- SUM_RESULTS\3DSMAX\SUMMARY.TXT
3dsmax-03 Weighted Geometric Mean = 16.99
---------- SUM_RESULTS\CATIA\SUMMARY.TXT
catia-01 Weighted Geometric Mean = 14.27
---------- SUM_RESULTS\ENSIGHT\SUMMARY.TXT
ensight-01 Weighted Geometric Mean = 20.60
---------- SUM_RESULTS\LIGHT\SUMMARY.TXT
light-07 Weighted Geometric Mean = 12.34
---------- SUM_RESULTS\MAYA\SUMMARY.TXT
maya-01 Weighted Geometric Mean = 18.69
---------- SUM_RESULTS\PROE\SUMMARY.TXT
proe-03 Weighted Geometric Mean = 16.74
---------- SUM_RESULTS\SW\SUMMARY.TXT
sw-01 Weighted Geometric Mean = 14.16
---------- SUM_RESULTS\UGS\SUMMARY.TXT
ugs-04 Weighted Geometric Mean = 18.35
blckgrffn - Thursday, February 24, 2005 - link
Let's hope that they don't post it because they know that running 1T is imperative to get good performance number, and thus use it by default.Hans Maulwurf - Wednesday, February 23, 2005 - link
Many other sites don´t publish their command rate either, this looks very strange for me. Most sites used to publish them before. I don´t understand...L3p3rM355i4h - Wednesday, February 23, 2005 - link
I'm assuming 1T, although the ammount of pwnage that would occur if it was 2T would be incredible.Zebo - Wednesday, February 23, 2005 - link
Derek/Anand- Why is it you don't say what A64's command rate was? 1T or 2T? This makes a huge impact on A64's performance (as shown by Anand right here and myself in forums) and is sloppy jounalism to leave out. Sure "other" sites do this crap but not anandtech.:|Dualboy24 - Wednesday, February 23, 2005 - link
I am just not finding the releases to be impressive lately... I am waiting to see the future dual core etc... perhaps that will wow us all. Its just not like the 90s anymore where it was always an exciting time with CPUs.Perhaps a battle between 56kbps modem models would prove entertaining :) L()L
neogodless - Tuesday, February 22, 2005 - link
#64 I'm saying I don't bother. I don't do that at work (P42.4C) either. At work, I listen to MP3s while having 2 e-mail clients open, various browser windows and tabs, a development environment, FTP, database manager, various IM programs, remote desktop, etc. And I do about the same at home, though usually on a smaller scale. And it works fine. However, if I go to a web page that gobbles up resources (poorly written javascript, i can give you an example page), I'm able to do everything else on the HT machine which shows about "53%" overall CPU usage. An the Athlon 64, if something gobbles up CPU, I see "99%" usage and a sluggish environment. But it's ALL subjective... I want to see Objective measurements.I also don't want to see Athlon vs. Intel opinions/flames because I'm not claiming one or the other is better... just asking for objective measurements.
RZaakir - Tuesday, February 22, 2005 - link
neo, are you saying that you have problems running a game and listening to MP3s simultaneously on your Athlon 64?RockHydra11 - Tuesday, February 22, 2005 - link
Disappointing to say the least....neogodless - Tuesday, February 22, 2005 - link
I'm not sure why I got attacked for requesting Multi-tasking benchmarks. I prefer my AMD for gaming, and I prefer the Intel at work where I run lots of programs at once but (unfortunately) never game. It's not a fair comparison anyway because my home machine is limited by only one monitor, while my work machine has two.Yes, many benchmarks are optimized for Hyperthreading, and if they are synthetic, then it doesn't matter. I'm asking for benchmarks with programs you use every day. If they're optimized for Hyperthreading, then you will see real world benefit from that, when using an HT enabled processor.
When I run games on my AMD64, it gobbles up all the CPU (even if it's an old game) for whatever reason, and I don't find it practical to leave a game running in the background while doing something else. I've done it, and it didn't greatly hinder doing some small task like check e-mail or send an instant message, but I wouldn't intentionally do it, especially if I decided I'd rather listen to Mp3s than finish my game...