The Team Group MP34 512GB SSD Review: Refining Phison's NVMe Workhorse
by Billy Tallis on May 15, 2019 9:00 AM EST- Posted in
- SSDs
- Storage
- Toshiba
- Phison
- M.2
- NVMe
- BiCS
- 3D TLC
- Team Group
- PS5012-E12
Sequential Read Performance
Our first test of sequential read performance uses short bursts of 128MB, issued as 128kB operations with no queuing. The test averages performance across eight bursts for a total of 1GB of data transferred from a drive containing 16GB of data. Between each burst the drive is given enough idle time to keep the overall duty cycle at 20%.
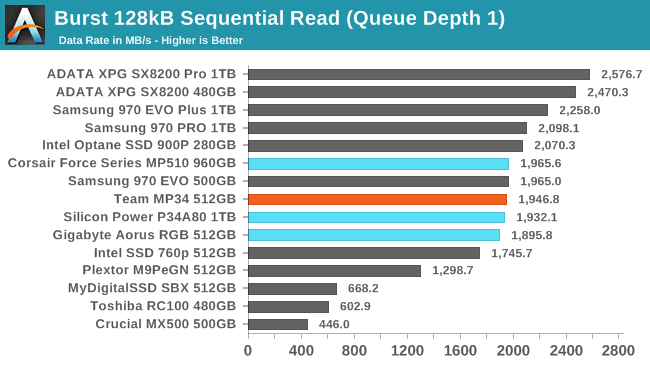
The Team Group MP34's newer firmware brings a few percent improvement to the burst sequential read speed, but the Phison E12 drives are all still stuck below 2GB/s while Silicon Motion SM2262(EN) drives are around 2.5GB/s at QD1.
Our test of sustained sequential reads uses queue depths from 1 to 32, with the performance and power scores computed as the average of QD1, QD2 and QD4. Each queue depth is tested for up to one minute or 32GB transferred, from a drive containing 64GB of data. This test is run twice: once with the drive prepared by sequentially writing the test data, and again after the random write test has mixed things up, causing fragmentation inside the SSD that isn't visible to the OS. These two scores represent the two extremes of how the drive would perform under real-world usage, where wear leveling and modifications to some existing data will create some internal fragmentation that degrades performance, but usually not to the extent shown here.
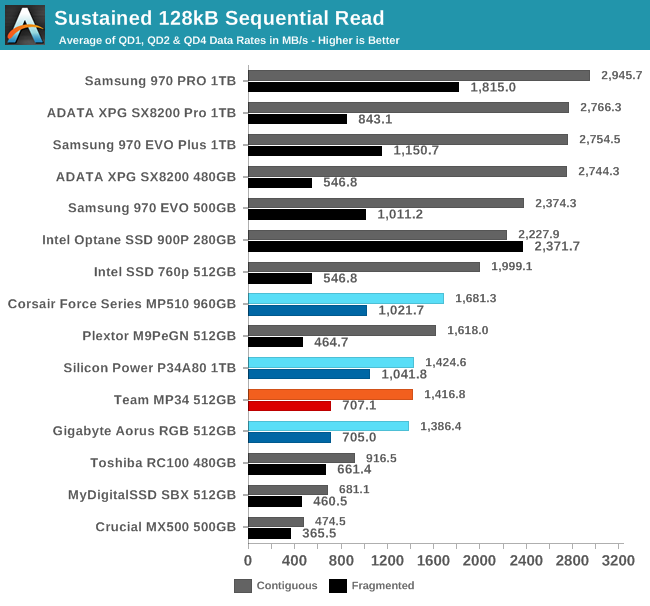
On the longer sequential read test, the Phison E12 drives including the Team MP34 are all at a clear disadvantage to the Samsung or Silicon Motion based competition. However, in the worst case scenario of reading data that was written as random writes, the MP34 performs reasonably well: ahead of the Silicon Motion drives but still slower than Samsung.
 |
|||||||||
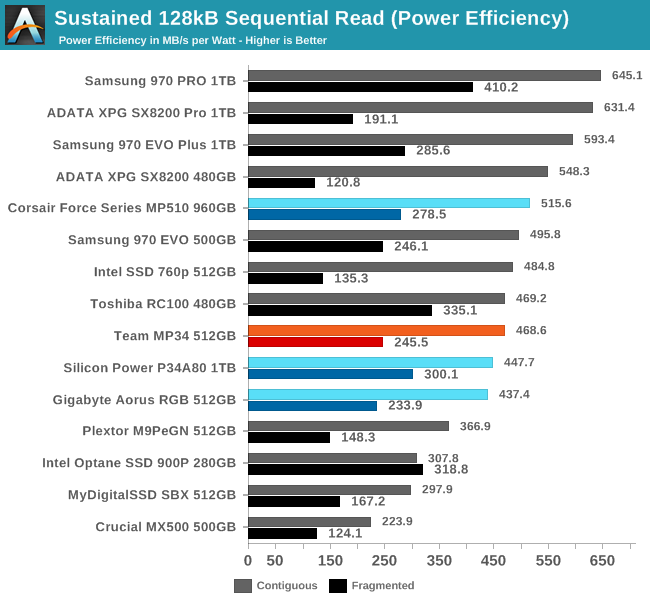
| Power Efficiency in MB/s/W | Average Power in W | ||||||||
The power efficiency of the Team MP34 is naturally better than the Gigabyte Aorus SSD with RGB LEDs, and it is almost tied with the Samsung 970 EVO 500GB. In absolute terms, the power draw by the MP34 during the sequential read test was lower than any other high-end NVMe SSD, but still clearly higher than SATA and entry-level NVMe drives.
 |
|||||||||
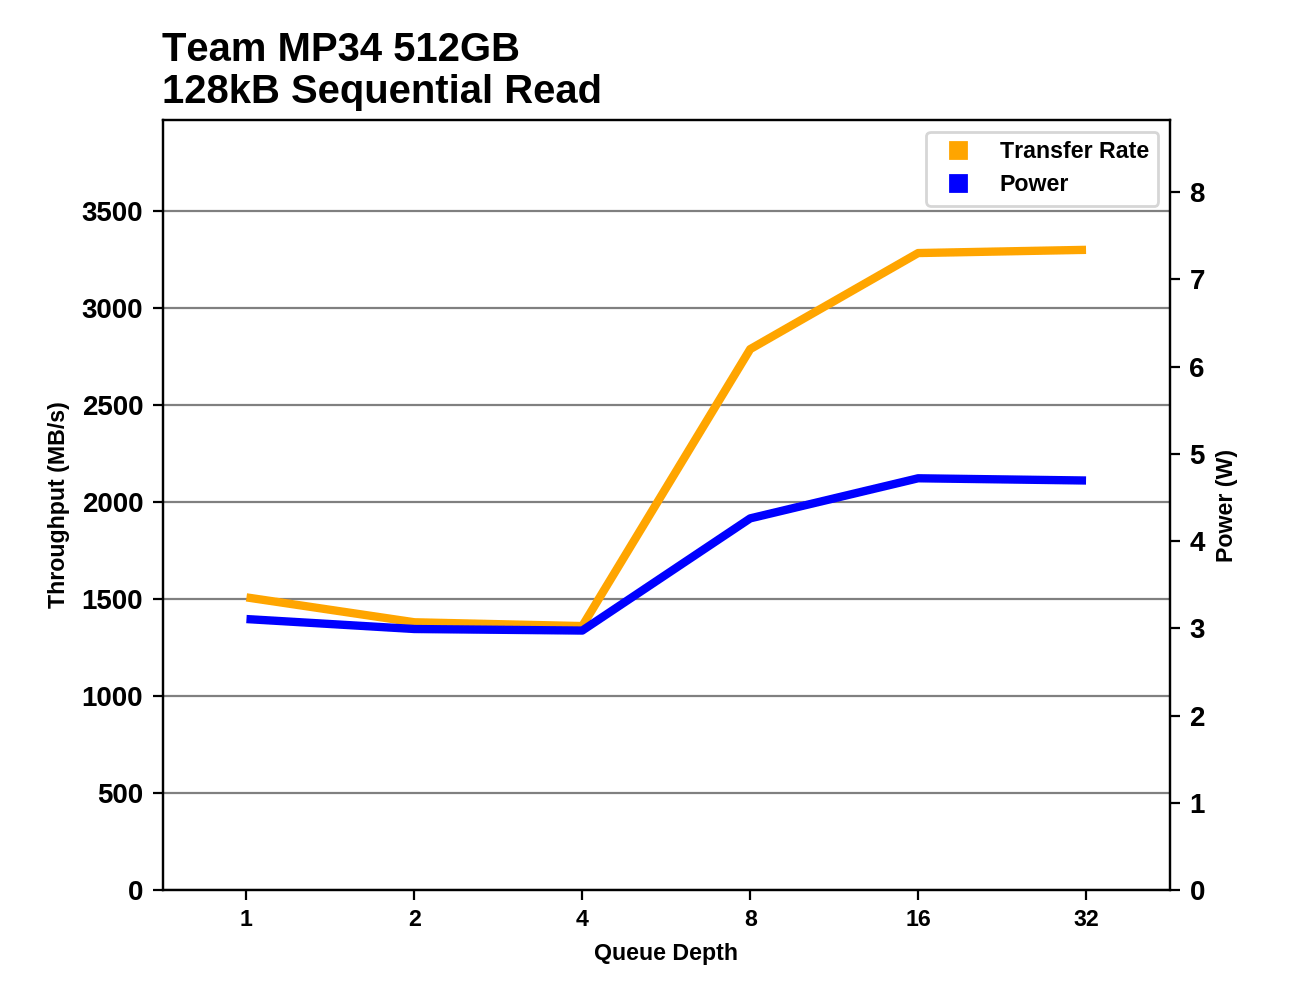
Like other Phison E12 drives, the Team MP34 is hurt by sequential read performance that stays basically flat until queue depths increase beyond QD4, and our scores above focus specifically on low queue depths. At sufficiently high queue depths, the MP34 reaches reasonable speeds for a high-end drive.
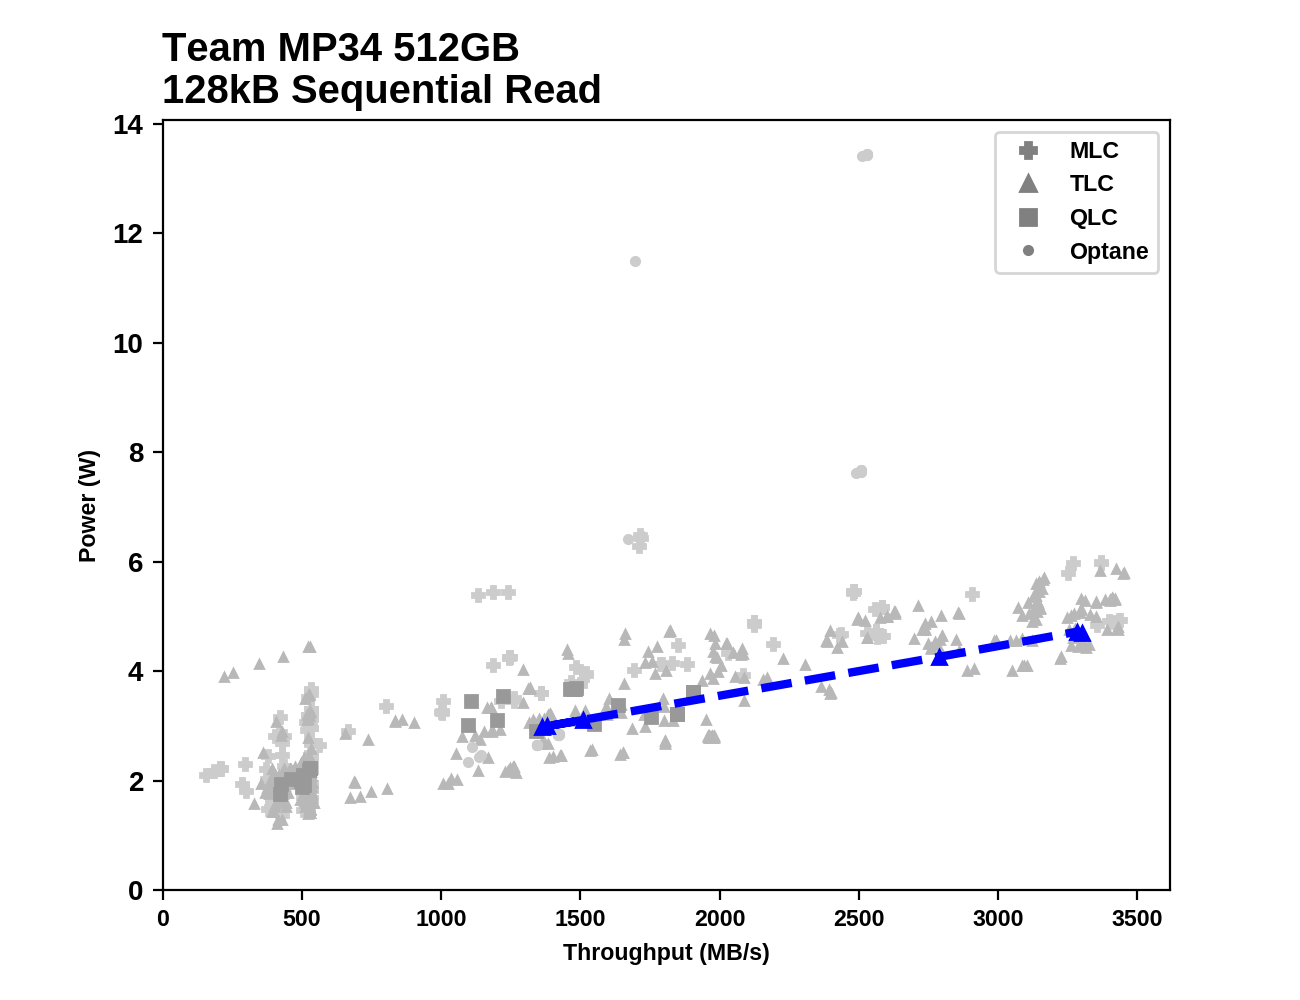
The sequential read speeds from the Team MP34 span a wide range of speeds, depending on queue depth. At low and high queue depths, it operates with reasonable efficiency, but for low queue depths there are several entry-level NVMe drives that offer better efficiency for similar or better speeds.
Sequential Write Performance
Our test of sequential write burst performance is structured identically to the sequential read burst performance test save for the direction of the data transfer. Each burst writes 128MB as 128kB operations issued at QD1, for a total of 1GB of data written to a drive containing 16GB of data.
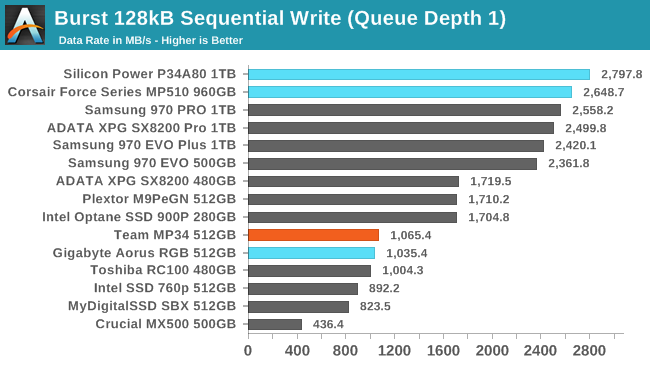
The 1TB Phison E12 drives have some of the best scores on our burst sequential write test, but the 512GB drives like the Team MP34 offer less than half of the performance. The MP34 manages just over 1GB/s while the Plextor M9Pe hits 1.7GB/s with the same NAND and the 500GB Samsung 970EVO is well over 2GB/s.
Our test of sustained sequential writes is structured identically to our sustained sequential read test, save for the direction of the data transfers. Queue depths range from 1 to 32 and each queue depth is tested for up to one minute or 32GB, followed by up to one minute of idle time for the drive to cool off and perform garbage collection. The test is confined to a 64GB span of the drive.
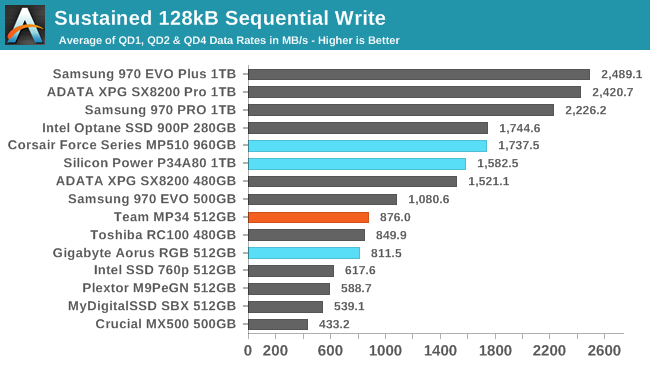
On the longer sequential write test, there are fewer 512GB-class drives that beat the Team MP34, but the Samsung and Silicon Motion drives both manage to do so by a wide margin. As with the burst sequential write performance, the MP34's newer firmware gives it only a tiny advantage over the Gigabyte drive with older firmware.
 |
|||||||||
| Power Efficiency in MB/s/W | Average Power in W | ||||||||
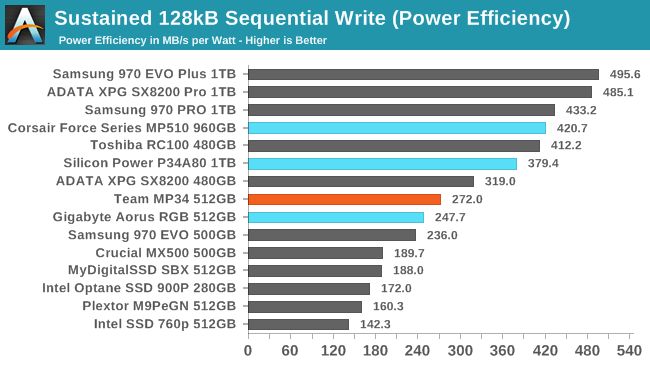
The power efficiency of the Team MP34 on the sustained sequential write test is pretty good for a 512GB-class drive, but pales in comparison to what the good 1TB drives offer. As usual, the MP34 is the least power-hungry high-end NVMe drive in this bunch, but in this case its performance isn't quite up to high-end standards.
 |
|||||||||
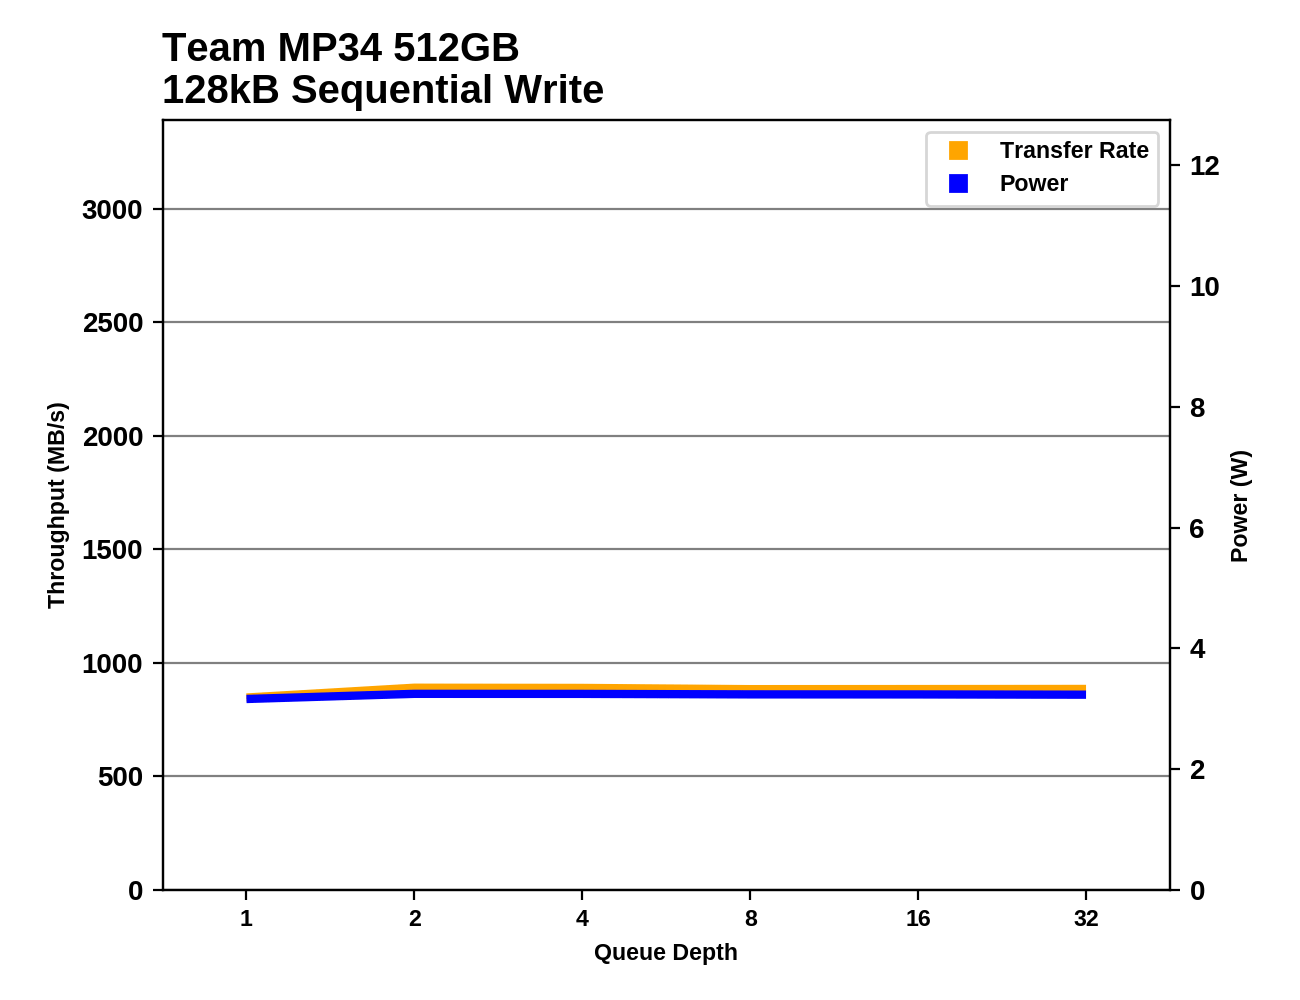
As with most drives on this test, the Team MP34's performance doesn't vary with capacity. The 1TB Phison E12 drives and a few others show variable performance because they are sometimes able to complete most or all of one of the test phases using just their SLC cache, but the SLC cache on the 512GB MP34 is too small for this test.
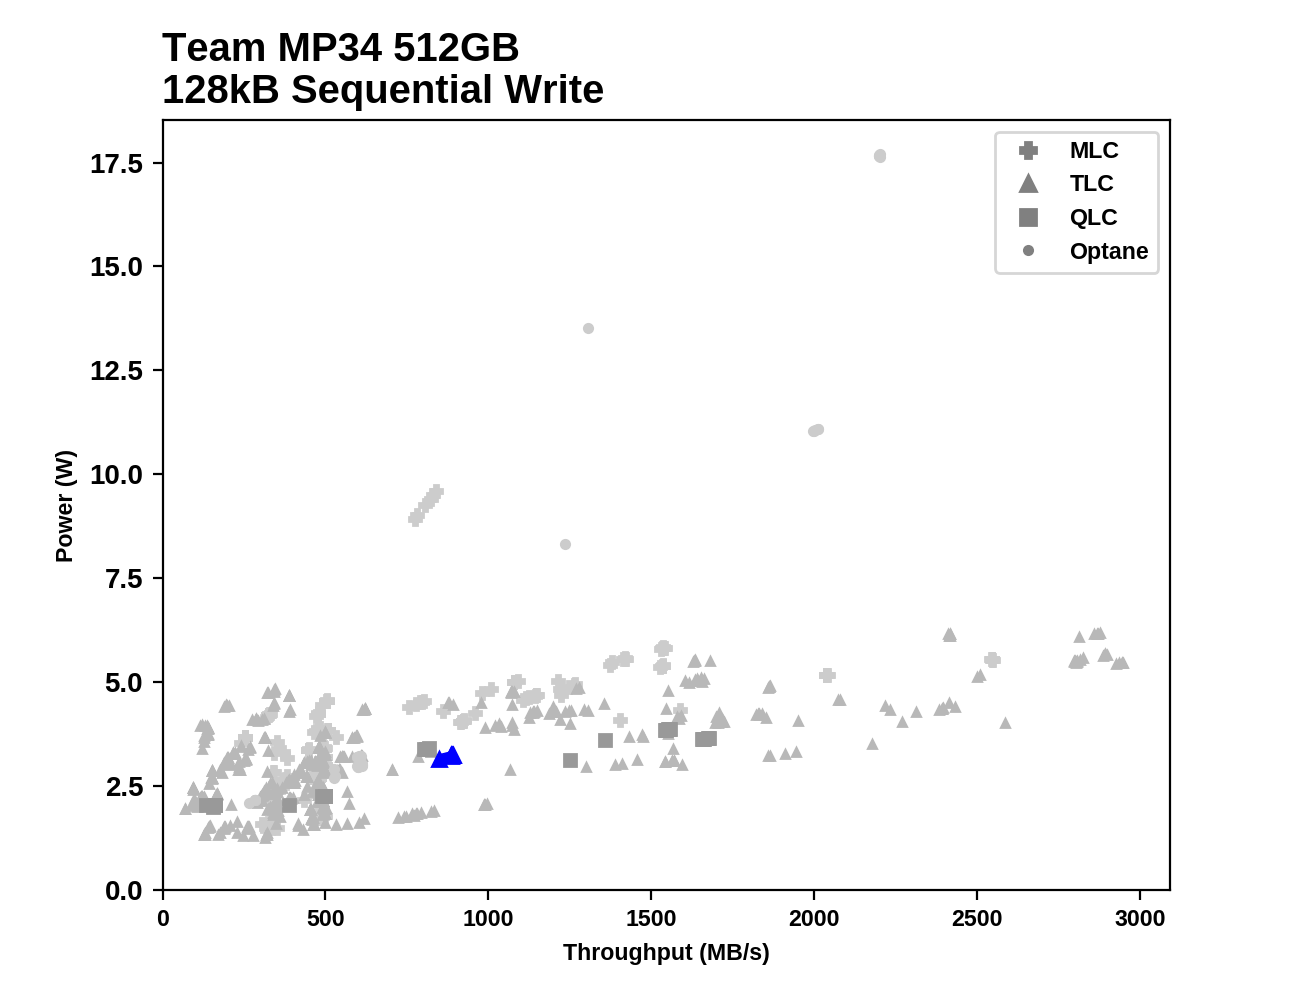
The sequential write performance of the Team MP34 is well above SATA levels and power efficiency is about average for the speeds it attains, but larger NVMe drives can provide vastly higher write speeds.


17 Comments
View All Comments
Samus - Wednesday, May 15, 2019 - link
Why is the WD Black missing from all the benchmarks - even the recently reviewed SN750 is missing?I’m at a loss here, you specifically mentioned it on the first page of the article, along with Samsung, yet included all the Samsung drives...
futrtrubl - Wednesday, May 15, 2019 - link
Last page. "..if we had the chance to test the 500GB WD Black SN750"kobblestown - Wednesday, May 15, 2019 - link
FWIW, I just bought a 480GB Corsair MP510 and the firmware is reported as ECFM12.2. I don't know if it's available for update of older devices though.ssd-user - Wednesday, May 15, 2019 - link
Can you _please_ sort the SSD's by worst-case ("disk full") numbers rather than best-case ones? I generally really like your reviews, but your sorting is simply wrong, and some horribly bad ssd's end up looking much better than they are because of it.Particularly for things like the 99% latency numbers it is inane to sort by the best case, since the whole point is about near-worst-case latencies, and bad controller should simply not be given the benefit of the doubt.
Note that unless you actually trim the ssd, even an empty filesystem will act like a full one, since the ssd doesn't know which parts are used. So as far as the ssd is concerned, it's all full. So the argument that "most people have lots of room on their disk" is quite likely bogus to begin with, but possibly entirely irrelevant even if it were to be true.
Death666Angel - Thursday, May 16, 2019 - link
They are storted by worst-case, just in reverse. And if you use an SSD without an automatic trim OS, it's kinda on you, isn't it?ssd-user - Thursday, May 16, 2019 - link
Death666Angel: please learn to read. They are *not* "sorted by worst-case, just in reverse".Look at the "ATSB - Heavy (99th Percentile Latency)" graph, just as an example.
In particular, look at the ADATA XPG SX8200 Pro 1TB one. Look at how absolutely *HORRIBLE* the latency is for that.
Yet the idiotic and incorrect sorting shows it as the second-best SSD on that list, because the *best-case* latency when the drive is empty is reasonable. But once it gets full, and $
Anybody who thinks that that drive should be second-best on that list is incompetent.
ssd-user - Thursday, May 16, 2019 - link
Fat-fingered the response. The "and $" should be "and garbage collection happens, latency becomes horrid".Death666Angel - Saturday, May 18, 2019 - link
I still stand by "If you have an OS that uses GC as a valid algorithm, you desever all the crap you brought upon yourself." But have fun being a blast at parties! Learn to read fricking diagrams and stop bitching. Or start being the change you wanna see in the world!leexgx - Saturday, May 18, 2019 - link
the issue is only with the dramless drives when they are above 60-70% full witch you should avoid (the sandisk/WD blue recant controller is cida dramless but it has 10mb of ram on the controller it self witch seems to be enough to mitigate the lack of a full blown dram)ssd-user - Sunday, May 19, 2019 - link
Exactly. The point is that you should avoid those drives.Which is why they shouldn't show up at the top of the charts. They are not top drives, they are the dregs, and they should show up as such.