The Mate 20 & Mate 20 Pro Review: Kirin 980 Powering Two Contrasting Devices
by Andrei Frumusanu on November 16, 2018 8:10 AM EST- Posted in
- Smartphones
- Huawei
- Mobile
- Kirin 980
- Mate 20
- Mate 20 Pro
GPU Performance & Power
The Kirin 980 is the first SoC to sport Arm’s newest generation Mali G76 GPU. The new IP differs significantly to previous generations, in more or less simplified terms, in that the GPU cores are essentially twice as big and capable as the previous generation Mali G72 cores. So while the G76MP10 configuration of the Kirin 980 might sound small, it’s not small at all in terms of theoretical performance.
GPU performance and efficiency has been a big thorn in the side of both the Kirin 960 and 970, as both SoCs showcased less than stellar power figures, which in turn also resulted in forced limited clocks and performance of the GPUs. It’s here that Huawei made the biggest promises in terms of improvements: a claimed 46% increase in performance while showcasing a staggering 178% increase in power efficiency. The latter figure especially caught some attention, as you just don’t see such increases in the industry.
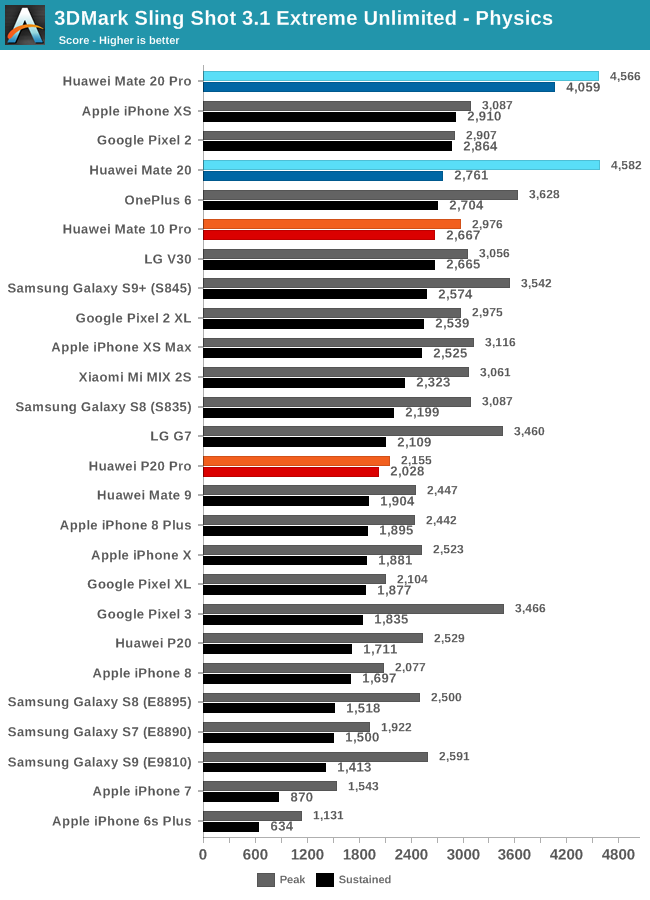
Starting off with 3DMark Sling Shot Extreme Unlimited and the Physics sub-test, we see the Mate 20’s showcase some leading peak performance figures. This test is mainly a CPU test with just some more minor GPU load. The performance jump here undoubtedly comes from the new Cortex A76 microarchitecture.
In terms of sustained performance, we see some diverging figures between the Mate 20 and Mate 20 Pro, as the Pro is able to reach much higher sustained scores. Before getting into any conclusions, it’s worth to also look at the GPU results.
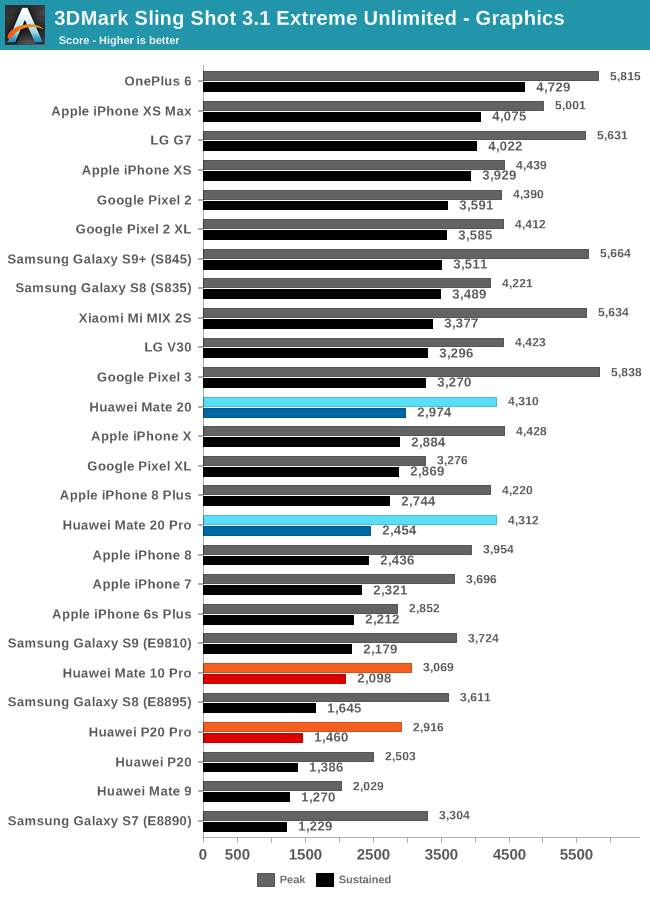
On the Graphics sub-test, we see both new Mate 20’s reach respectable peak performance figures, however they are both still throttling quite a lot until they reach thermal equilibrium. Comparing the results to the stock firmware Kirin 970’s, such as the P20 Pro, the performance increase is nevertheless quite significant.
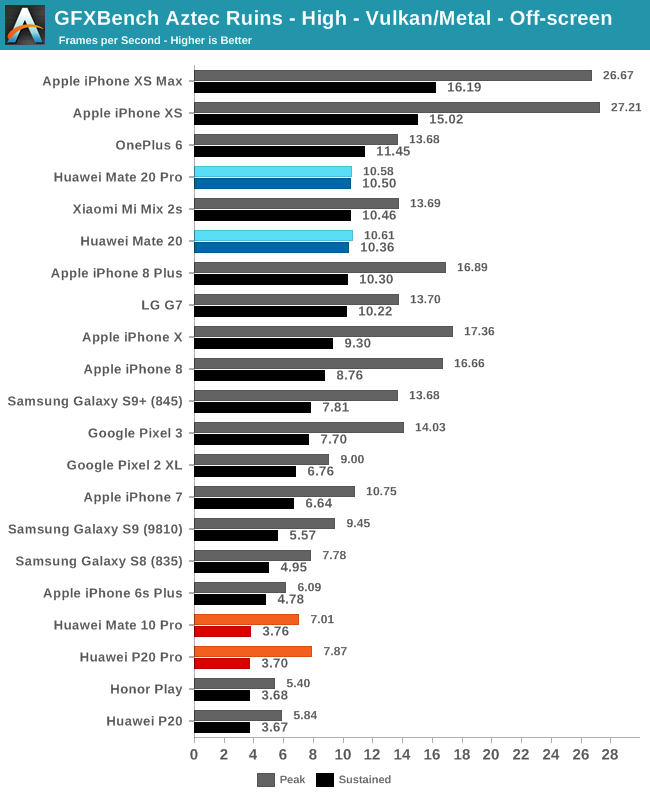
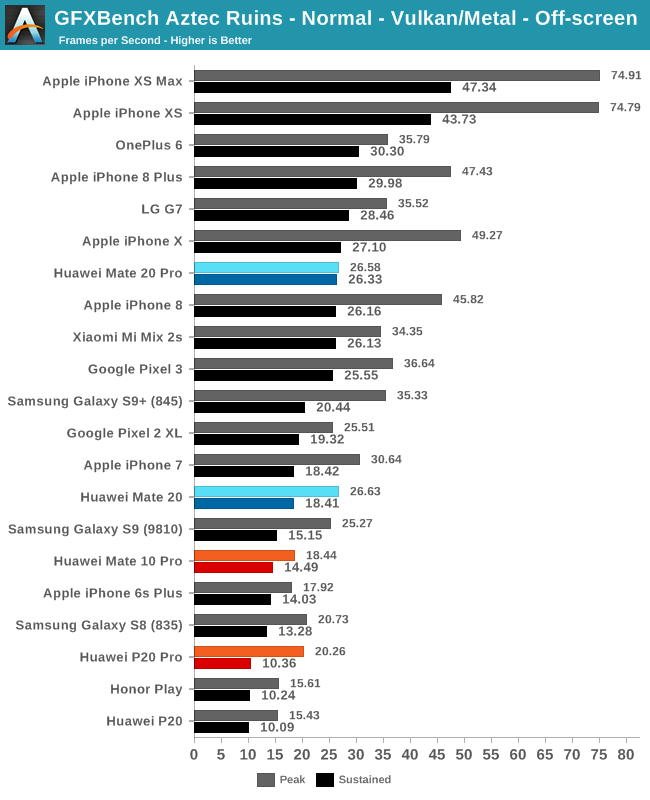
In the new Aztec Ruins Vulkan benchmarks, both in High and Normal quality modes, we see some really odd performance behaviour. While the peak performance isn’t all that great, the sustained performance is pretty much almost identical. On the Normal run the Mate 20 Pro actually was able to maintain a higher performance than the Mate 20, something that we also saw on the 3DMark Physics run. It would be definitely interesting if the benchmark is in some way CPU bound, or if the devices have different thermal limits between Vulkan and OpenGLES workloads.
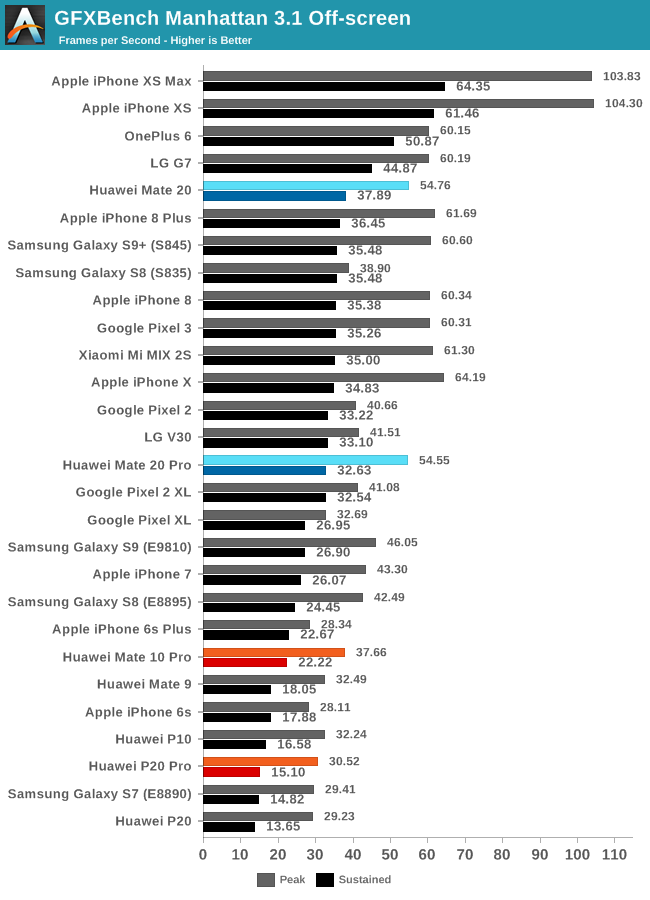
In Manhattan 3.1, we see again respectable performance gains both in peak and sustained figures. Compared to the Vulkan runs, these scores showcase a more expected delta between peak and sustained. The Kirin 980 here generally matches most Snapdragon 845 devices – short of the OnePlus 6 and G7 which seem to allow much higher sustained power limits.
| GFXBench Manhattan 3.1 Offscreen Power Efficiency (System Active Power) |
||||
| Mfc. Process | FPS | Avg. Power (W) |
Perf/W Efficiency |
|
| iPhone XS (A12) Warm | 7FF | 76.51 | 3.79 | 20.18 fps/W |
| iPhone XS (A12) Cold / Peak | 7FF | 103.83 | 5.98 | 17.36 fps/W |
| Galaxy S9+ (Snapdragon 845) | 10LPP | 61.16 | 5.01 | 11.99 fps/W |
| Huawei Mate 20 Pro (Kirin 980) | 7FF | 54.54 | 4.57 | 11.93 fps/W |
| Galaxy S9 (Exynos 9810) | 10LPP | 46.04 | 4.08 | 11.28 fps/W |
| Galaxy S8 (Snapdragon 835) | 10LPE | 38.90 | 3.79 | 10.26 fps/W |
| LeEco Le Pro3 (Snapdragon 821) | 14LPP | 33.04 | 4.18 | 7.90 fps/W |
| Galaxy S7 (Snapdragon 820) | 14LPP | 30.98 | 3.98 | 7.78 fps/W |
| Huawei Mate 10 (Kirin 970) | 10FF | 37.66 | 6.33 | 5.94 fps/W |
| Galaxy S8 (Exynos 8895) | 10LPE | 42.49 | 7.35 | 5.78 fps/W |
| Galaxy S7 (Exynos 8890) | 14LPP | 29.41 | 5.95 | 4.94 fps/W |
| Meizu PRO 5 (Exynos 7420) | 14LPE | 14.45 | 3.47 | 4.16 fps/W |
| Nexus 6P (Snapdragon 810 v2.1) | 20Soc | 21.94 | 5.44 | 4.03 fps/W |
| Huawei Mate 8 (Kirin 950) | 16FF+ | 10.37 | 2.75 | 3.77 fps/W |
| Huawei Mate 9 (Kirin 960) | 16FFC | 32.49 | 8.63 | 3.77 fps/W |
| Huawei P9 (Kirin 955) | 16FF+ | 10.59 | 2.98 | 3.55 fps/W |
Looking at the power efficiency during Manhattan 3.1, we unfortunately see that the phone and chipset didn’t quite meet my projections in efficiency. Performance is exactly where it should be, however the power is off by about 1W as I had hoped to see about 3.5W peak power. At peak performance of both chipsets, the Kirin 980 showcases a 100% efficiency gain over the Kirin 970, which is still a pretty massive generational improvement, even if the previous generation didn’t exactly set the bar all that high.
In regards to Huawei’s 178% power efficiency claim during the chipset’s announcement: I still think this number is correct, however evidently this was a traditional case of somewhat misleading presentation or a mixup between “or” and “and” in the relationship between the performance and power efficiency improvements. Now in hindsight, the 178% efficiency figure likely refers to the efficiency advantage of the Kirin 980 at the same performance of the Kirin 970, which given the measured power figures here, is something that’s definitely plausible.
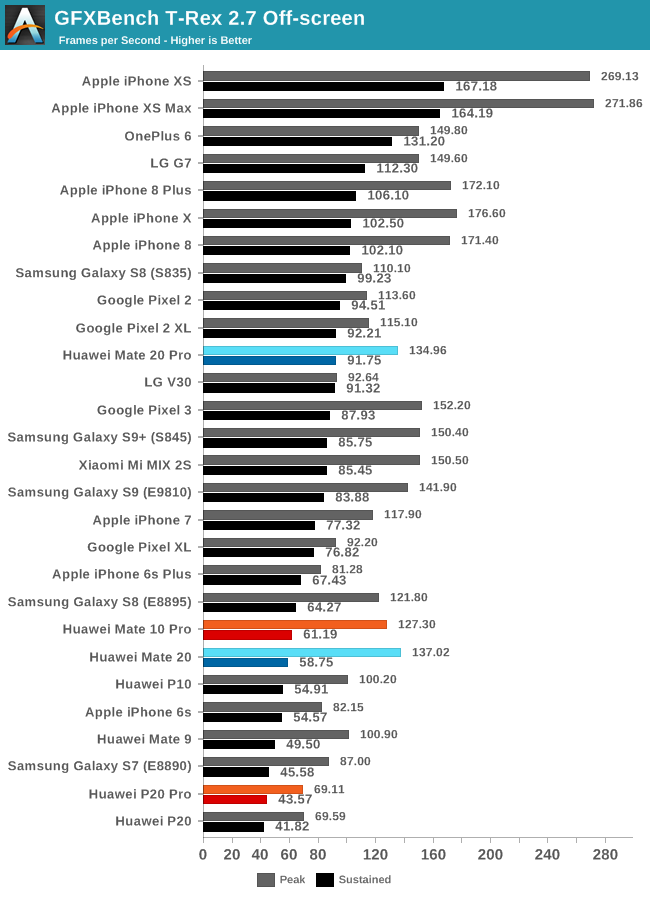
In T-Rex, the peak performance improvements over the Kirin 970 are far less, and I do wonder exactly what the bottleneck here is. Nevertheless, the sustained performance jumps 50%, but yet again this is just for the Mate 20 Pro as the regular Mate 20 sees far more severe throttling. T-Rex would be in many ways CPU bound as it’s hitting very high frame-rates on modern SoCs.
| GFXBench T-Rex Offscreen Power Efficiency (System Active Power) |
||||
| Mfc. Process | FPS | Avg. Power (W) |
Perf/W Efficiency |
|
| iPhone XS (A12) Warm | 7FF | 197.80 | 3.95 | 50.07 fps/W |
| iPhone XS (A12) Cold / Peak | 7FF | 271.86 | 6.10 | 44.56 fps/W |
| Galaxy S9+ (Snapdragon 845) | 10LPP | 150.40 | 4.42 | 34.00 fps/W |
| Galaxy S9 (Exynos 9810) | 10LPP | 141.91 | 4.34 | 32.67 fps/W |
| Galaxy S8 (Snapdragon 835) | 10LPE | 108.20 | 3.45 | 31.31 fps/W |
| Huawei Mate 20 Pro (Kirin 980) | 7FF | 135.75 | 4.64 | 29.25 fps/W |
| LeEco Le Pro3 (Snapdragon 821) | 14LPP | 94.97 | 3.91 | 24.26 fps/W |
| Galaxy S7 (Snapdragon 820) | 14LPP | 90.59 | 4.18 | 21.67 fps/W |
| Galaxy S8 (Exynos 8895) | 10LPE | 121.00 | 5.86 | 20.65 fps/W |
| Galaxy S7 (Exynos 8890) | 14LPP | 87.00 | 4.70 | 18.51 fps/W |
| Huawei Mate 10 (Kirin 970) | 10FF | 127.25 | 7.93 | 16.04 fps/W |
| Meizu PRO 5 (Exynos 7420) | 14LPE | 55.67 | 3.83 | 14.54 fps/W |
| Nexus 6P (Snapdragon 810 v2.1) | 20Soc | 58.97 | 4.70 | 12.54 fps/W |
| Huawei Mate 8 (Kirin 950) | 16FF+ | 41.69 | 3.58 | 11.64 fps/W |
| Huawei P9 (Kirin 955) | 16FF+ | 40.42 | 3.68 | 10.98 fps/W |
| Huawei Mate 9 (Kirin 960) | 16FFC | 99.16 | 9.51 | 10.42 fps/W |
Again, the power efficiency as measured on T-Rex sees a significant jump over the Kirin 970, however most of this improvement is simply going towards reducing the actual power usage from the ridiculously high values of its predecessor, with only a little gained peak performance.
I wouldn’t take this as a definitive verdict on the Mali G76 as of yet, as over the last 3 generations Samsung has been able to extract much better results out of their GPU implementations inside the Exynos SoCs than what HiSilicon was able to achieve in the Kirins. The next generation Exynos 9820 should be able to do better than this, so maybe that’s where the Mali G76 will hit its projected targets.
Overall, the Kirin 980 definitely is posting substantial improvements over its predecessor, however Arm’s Mali GPU still seems to lag a tad behind the higher end competition from Apple and Qualcomm. What is definitely positive for Huawei is that the new SoC finally is able to shed off the atrocious performance showcased in the previous generation chipsets, and is now actually competitive with most recent devices.


141 Comments
View All Comments
SydneyBlue120d - Friday, November 16, 2018 - link
I'd like to see some mobile speed test compared with Snapdragons and Intel modems :)Great review as always, included the Lorem Impsum in the video recording video page :P
Andrei Frumusanu - Friday, November 16, 2018 - link
Cellular tests are extremely hard to do in non-controlled environments, it's something I'm afraid of doing again as in the past I've found issues with my past mobile carrier that really opened my eyes as to just how much the tests are affected by the base station's configuration.I'm editing the video page, will shortly update it.
jjj - Friday, November 16, 2018 - link
When you do the GPU's perf per W, why use peak not hot state average? And any chance you have any hot perf per W per mm2 data, would be interesting to see that.Have you checked if the Pto with max brightness throttles harder and by how much?
Hope LG can sort out power consumption for their OLED or they'll have quite some issues with foldable displays.
Andrei Frumusanu - Friday, November 16, 2018 - link
It's a fair point, it's something I can do in the future but I'd have to go back measure across a bunch of deices.What did you mean by Pto? The power consumption of the screen at max brightness should be quite high if you're showing very high APL content, so by definition that is 2-3W more to the TDP, even though it's dissipated on a large area.
jjj - Friday, November 16, 2018 - link
The Pro question was about the SoC throttling harder because of the display, could be and should be the case to some extend, especially if they did nothing about mitigating it but was curious how large the impact might be in a worse case scenario. - so SoC throttling with display at min power vs max power.Also related to this, does heat impact how brightness is auto-adjusted?
Andrei Frumusanu - Friday, November 16, 2018 - link
The 3D benchmarks are quite low APL so they shouldn't represent any notable difference in power. Manhattan for example is very dark.jjj - Friday, November 16, 2018 - link
I suppose you could run your CPU power virus while manipulating the display too, just to see the impact. The delta between min and max power for the display is so huge that you got to wonder how it impacts SoC perf.Chitti - Friday, November 16, 2018 - link
Nothing about speakers and sound output via USB-C and in Bluetooth earphones ?Andrei Frumusanu - Friday, November 16, 2018 - link
I'll add a speaker section over the weekend, the Mate 20 Pro's speakers have a good amount of bass and mid-range, however there's some lacking presence in the higher frequencies, as well as some obvious reverberations on the back glass panel. Covering up the USB-C port where the sound is coming from muffles things hard, so this is a big no-no in terms of audio quality when you have it plugged in.The Mate 20 just has the bottom mono speaker, which is a disadvantage in itself. Here there's some lack of bass and mid-range, with a very tinny bottom firing sound.
The USB-C headphones are good, but lacking a bit in clarify / lower high frequencies. They're ok but definitely not as good as Apple/Samsung/LG's included units.
jjj - Friday, November 16, 2018 - link
Went over the review quickly, is there anything on the proprietary microSD and storage (NAND) in general, just point me to the right page if possible.