The Toshiba XG6 1TB SSD Review: Our First 96-Layer 3D NAND SSD
by Billy Tallis on September 6, 2018 8:15 AM ESTSequential Read Performance
Our first test of sequential read performance uses short bursts of 128MB, issued as 128kB operations with no queuing. The test averages performance across eight bursts for a total of 1GB of data transferred from a drive containing 16GB of data. Between each burst the drive is given enough idle time to keep the overall duty cycle at 20%.
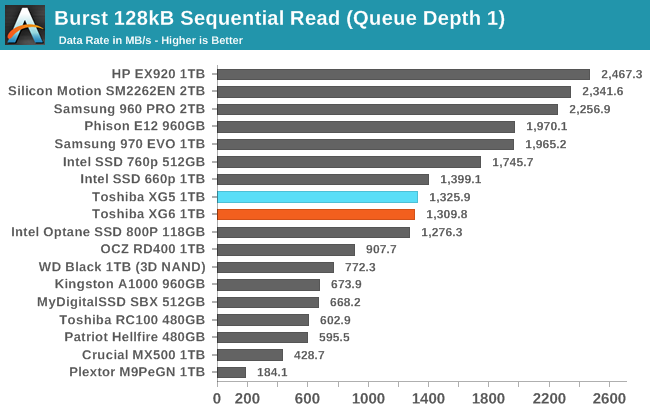
The burst sequential read speed of the Toshiba XG6 is slightly slower than the XG5, and still middle of the road for NVMe drives. The top drives are approaching twice the QD1 performance of the XG6, so this is probably where Toshiba needs to focus the most on improving.
Our test of sustained sequential reads uses queue depths from 1 to 32, with the performance and power scores computed as the average of QD1, QD2 and QD4. Each queue depth is tested for up to one minute or 32GB transferred, from a drive containing 64GB of data. This test is run twice: once with the drive prepared by sequentially writing the test data, and again after the random write test has mixed things up, causing fragmentation inside the SSD that isn't visible to the OS. These two scores represent the two extremes of how the drive would perform under real-world usage, where wear leveling and modifications to some existing data will create some internal fragmentation that degrades performance, but usually not to the extent shown here.
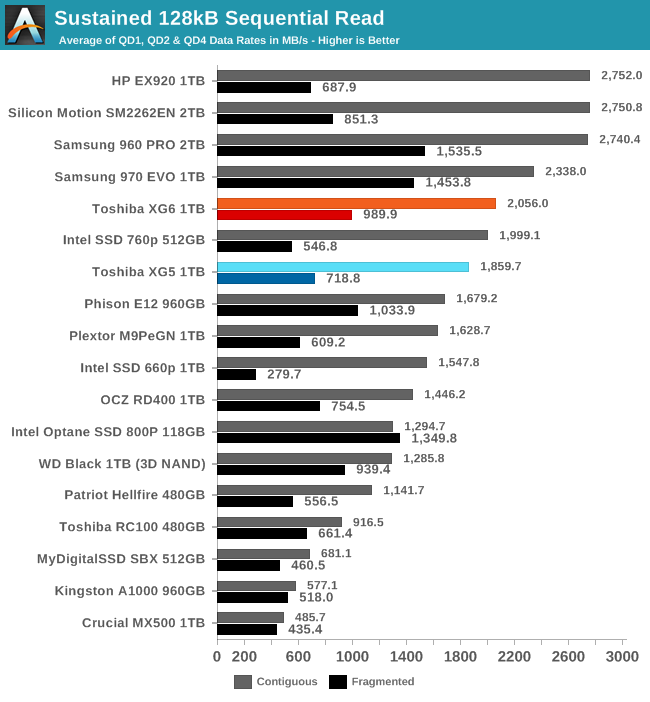
The longer sequential read test including moderately higher queue depths puts the XG6 in much better light, with clear improvement over the XG5 and scores that are behind only Samsung and Silicon Motion.
 |
|||||||||
| Power Efficiency in MB/s/W | Average Power in W | ||||||||
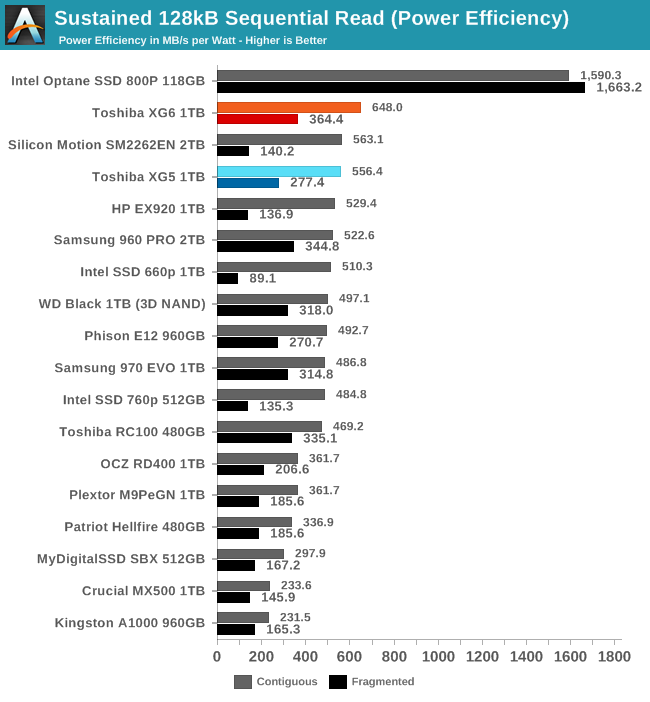
The power efficiency of the Toshiba XG6 during sequential reads is uncontested by anything other current drive using flash memory. It delivers 15% better performance per Watt than the SM2262EN that is tied for highest absolute performance.
 |
|||||||||
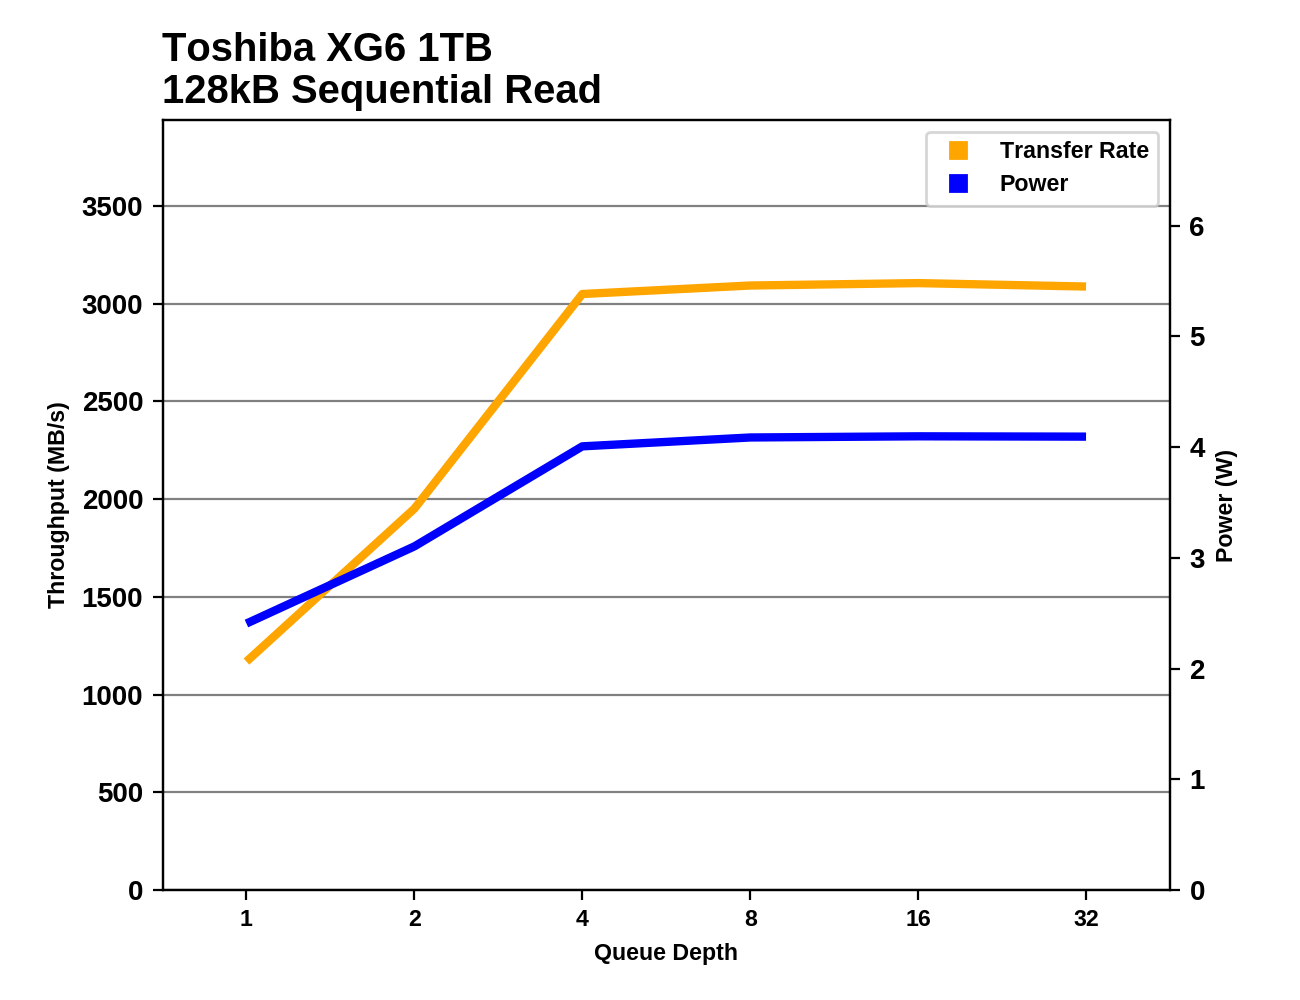
The Toshiba XG5 wasn't quite able to deliver its maximum sequential read speed at QD4, but the XG6 is saturated by then and delivers more than 3GB/s. The Silicon Motion controllers scale up in performance soonest, with the HP EX920 delivering full sequential read speed at QD2 while some high-end drives don't saturate until QD16.
Sequential Write Performance
Our test of sequential write burst performance is structured identically to the sequential read burst performance test save for the direction of the data transfer. Each burst writes 128MB as 128kB operations issued at QD1, for a total of 1GB of data written to a drive containing 16GB of data.
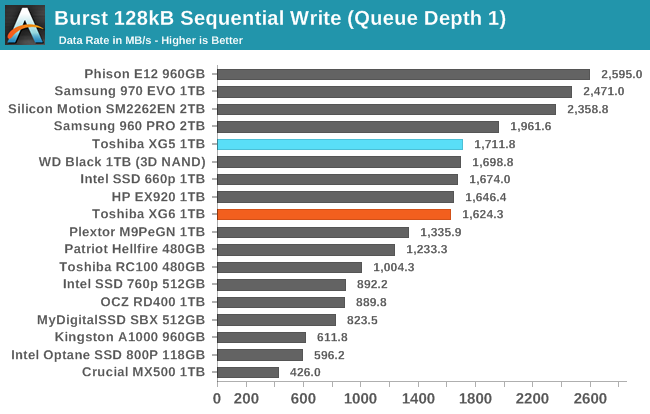
The burst sequential write speed of the Toshiba XG6 is another slight regression relative to the XG5, but it doesn't change its standing all that much. The Samsung 970 EVO and the upcoming high-end controllers from Silicon Motion and Phison offer substantially better QD1 performance, but the XG6 is more or less tied with most of the current high-end drives like the WD Black and the HP EX920.
Our test of sustained sequential writes is structured identically to our sustained sequential read test, save for the direction of the data transfers. Queue depths range from 1 to 32 and each queue depth is tested for up to one minute or 32GB, followed by up to one minute of idle time for the drive to cool off and perform garbage collection. The test is confined to a 64GB span of the drive.
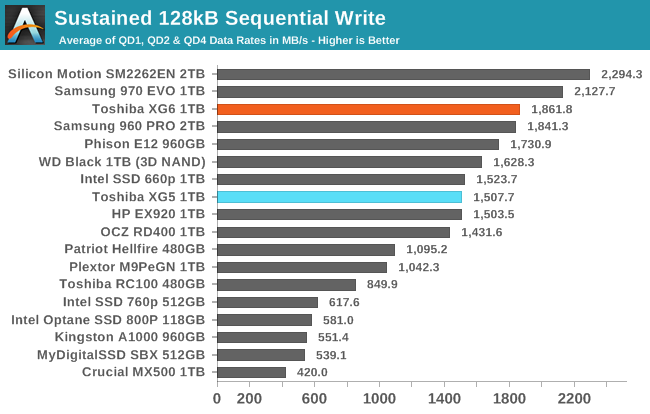
The sustained sequential write speed of the Toshiba XG6 is a substantial improvement over the XG5 and puts the XG6 very close to the top of the charts with clearly better performance than any of the BiCS3-based drives.
 |
|||||||||
| Power Efficiency in MB/s/W | Average Power in W | ||||||||
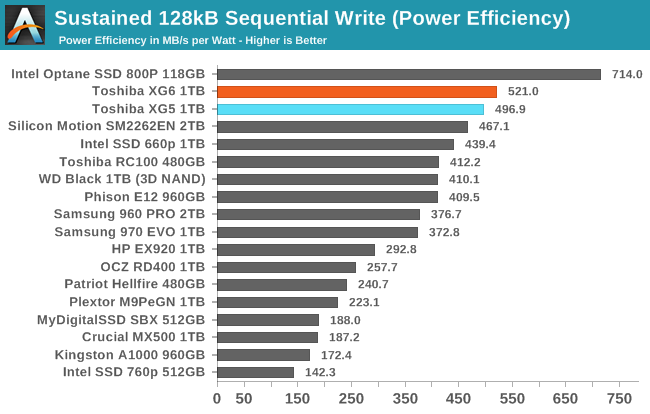
The Toshiba XG5 was still holding on to its lead in power efficiency (among flash-based SSDs), and the XG6 runs up the score by another 5% by delivering much higher performance while still drawing less power than any competing high-end NVMe drive.
 |
|||||||||
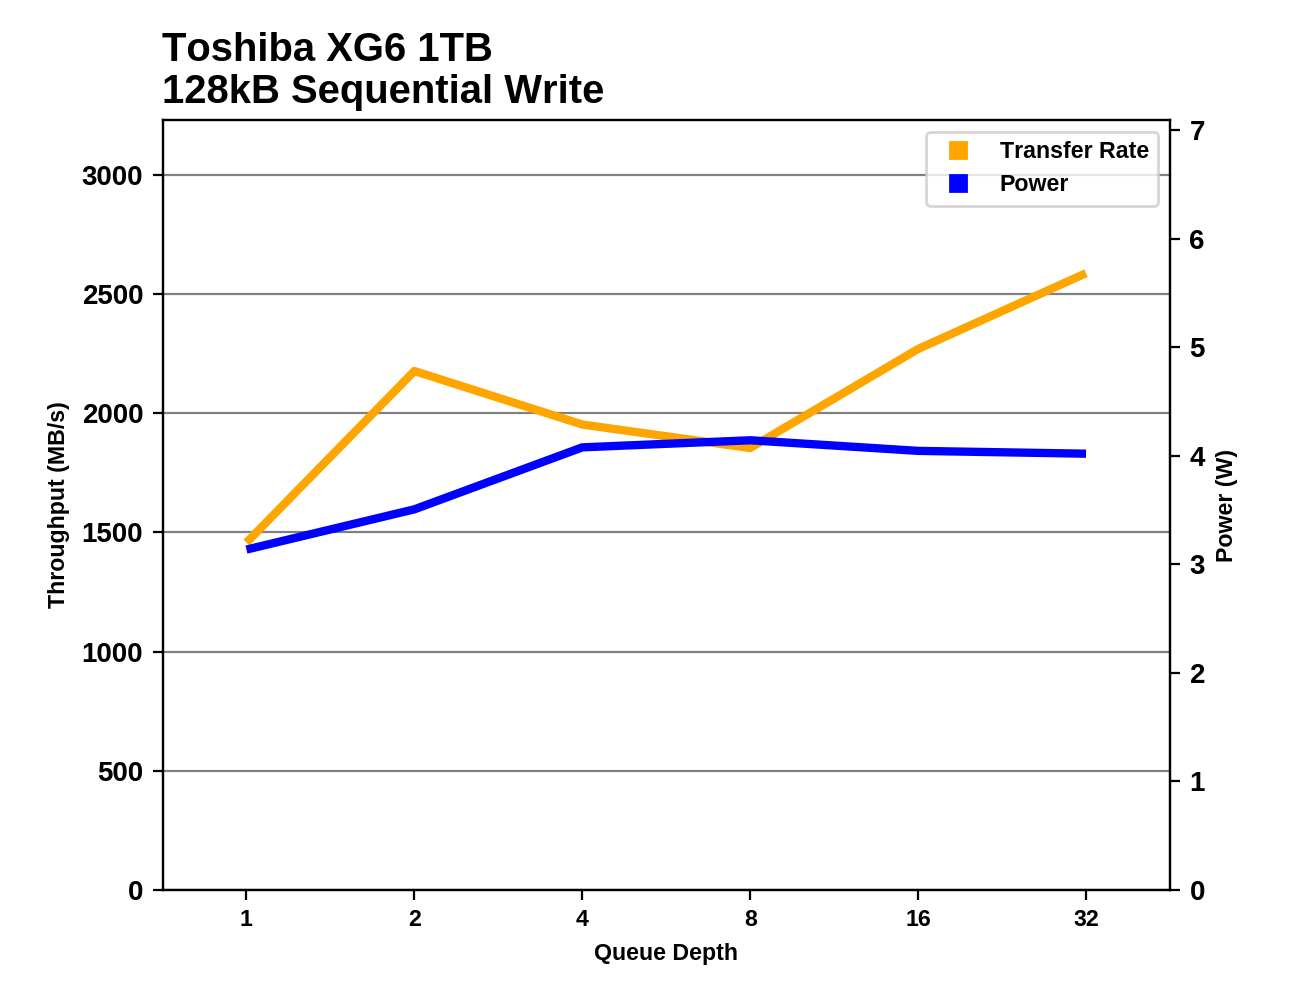
The sequential write performance of the XG6 shows some variability due to the SLC cache filling up and requiring some background work that doesn't fit within the idle time this test provides, but performance doesn't drop as much or as often as for the Phison E12, and the average at higher queue depths is still competitive with the drives that offer steadier write speeds.


31 Comments
View All Comments
Spoelie - Thursday, September 6, 2018 - link
2 short questions:- what happened to the plextor M9Pe, performance is hugely different from the review back in march.
- i know this is already the case for a year or so, but what happened to the perf consistency graphs, where can i deduce the same information from?
hyno111 - Thursday, September 6, 2018 - link
M9Pe had firmware updates, not sure if it's applied or related though.DanNeely - Thursday, September 6, 2018 - link
I don't recall the details, but something went wrong with generating the performance consistency data, and they were pulled pending finding a fix due to concerns they were no longer valid. IF you have the patience to dig through the archive, IIRC the situation was explained in the first review without them.Billy Tallis - Thursday, September 6, 2018 - link
I think both of those are a result of me switching to a new version of the test suite at the same time that I applied the Spectre/Meltdown patches and re-tested everything. The Windows and Linux installations were updated, and a few tweaks were made to the synthetic test configuration (such as separating the sequential read results according to whether the test data was written sequentially or randomly). I also applied all the drive firmware updates I could find in the April-May timeframe.The steady-state random write test as it existed a few years ago is gone for good, because it really doesn't say anything relevant about drives that use SLC caching, which is now basically every consumer SSD (except Optane and Samsung MLC drives). I also wasn't too happy with the standard deviation-based consistency metric, because I don't think a drive should be penalized for occasionally being much faster than normal, only much slower than normal.
To judge performance consistency, I prefer to look at the 99th percentile latencies for the ATSB real-world workload traces. Those tend to clearly identify which drives are subject to stuttering performance under load, without exaggerating things as much as an hour-long steady-state torture test.
I may eventually introduce some more QoS measures for the synthetic tests, but at the moment most of them aren't set up to produce meaningful latency statistics. (Testing at a fixed queue depth leads to the coordinated omission problem, potentially drastically understating the severity of things like garbage collection pauses.) At some point I'll also start graphing the performance as a drive is filled, but with the intention of observing things like SLC cache sizes, not for the sake of seeing how the drive behaves when you keep torturing it after it's full.
I will be testing a few consumer SSDs for one of my upcoming enterprise SSD reviews, and that will include steady-state full drive performance for every test.
svan1971 - Thursday, September 6, 2018 - link
I wish current reviews would use current hardware, the 970 Pro replaced the 960 Pro months ago.Billy Tallis - Thursday, September 6, 2018 - link
I've had trouble getting a sample of that one; Samsung's consumer SSD sampling has been very erratic this year. But the 970 Pro is definitely a different class of product from a mainstream TLC-based drive like the XG6. I would only include 970 Pro results here for the same reason that I include Optane results. They're both products for people who don't really care about price at all. There's no sensible reason to be considering a 970 Pro and an XG6-like retail drive as both potential choices for the same purchasing decision.mapesdhs - Thursday, September 6, 2018 - link
Please never stop including older models, the comparisons are always useful. Kinda wish the 950 Pro was in there too.Spunjji - Friday, September 7, 2018 - link
I second this. I know that I am (and feel most other savvy consumers would be) more likely to compare an older high-end product to a newer mid-range product, partly to see if it's worth buying the older gear at a discount and partly to see when there is no performance trade-off in dropping a cost tier.jajig - Friday, September 7, 2018 - link
I third it. I want to know if an upgrade is worth while.dave_the_nerd - Sunday, September 9, 2018 - link
Very much this. And not all of us upgrade our gear every year or two.