The Toshiba XG6 1TB SSD Review: Our First 96-Layer 3D NAND SSD
by Billy Tallis on September 6, 2018 8:15 AM ESTRandom Read Performance
Our first test of random read performance uses very short bursts of operations issued one at a time with no queuing. The drives are given enough idle time between bursts to yield an overall duty cycle of 20%, so thermal throttling is impossible. Each burst consists of a total of 32MB of 4kB random reads, from a 16GB span of the disk. The total data read is 1GB.
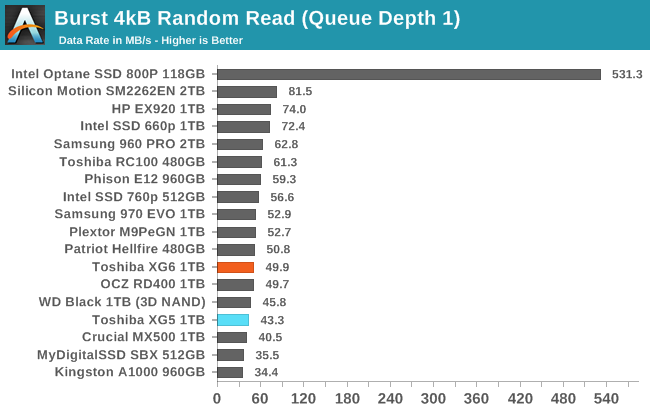
The burst random read performance of the Toshiba XG5 was rather slow and the XG6 improves on it but not enough to bring it up to par. Intel/Micron 3D TLC seems to offer substantially lower read latency, though some other drives have managed to get better random read performance out of BiCS TLC than Toshiba's XG series.
Our sustained random read performance is similar to the random read test from our 2015 test suite: queue depths from 1 to 32 are tested, and the average performance and power efficiency across QD1, QD2 and QD4 are reported as the primary scores. Each queue depth is tested for one minute or 32GB of data transferred, whichever is shorter. After each queue depth is tested, the drive is given up to one minute to cool off so that the higher queue depths are unlikely to be affected by accumulated heat build-up. The individual read operations are again 4kB, and cover a 64GB span of the drive.
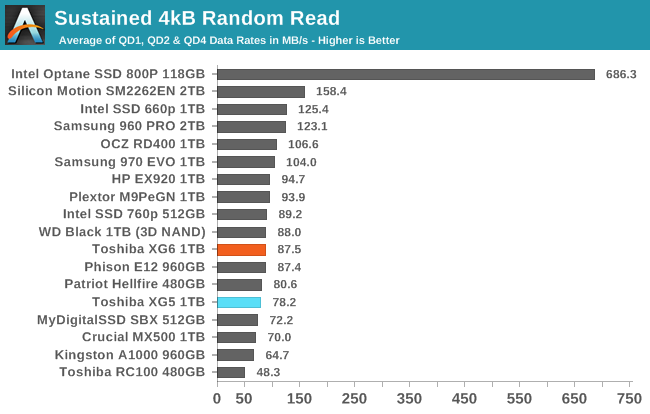
The rankings for sustained random read performance are largely similar to the burst random read test. The XG6 is improved over the XG5 but there's still quite a bit of room for improvement.
 |
|||||||||
| Power Efficiency in MB/s/W | Average Power in W | ||||||||
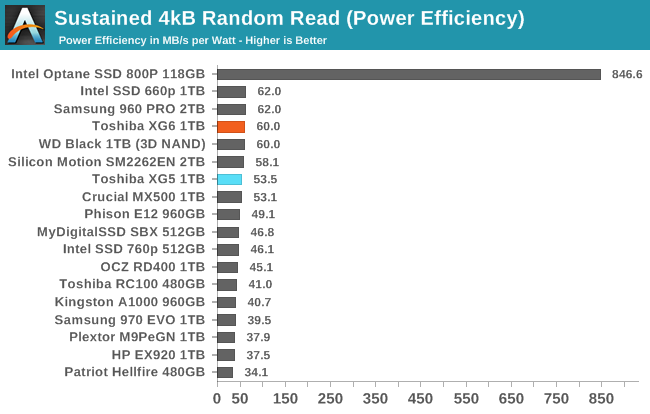
The XG6 puts Toshiba back into a tie for the best power efficiency from a TLC drive performing random reads, because the middle of the road performance doesn't require all that much power—just over half the power required by the SM2262EN's class-leading performance.
 |
|||||||||
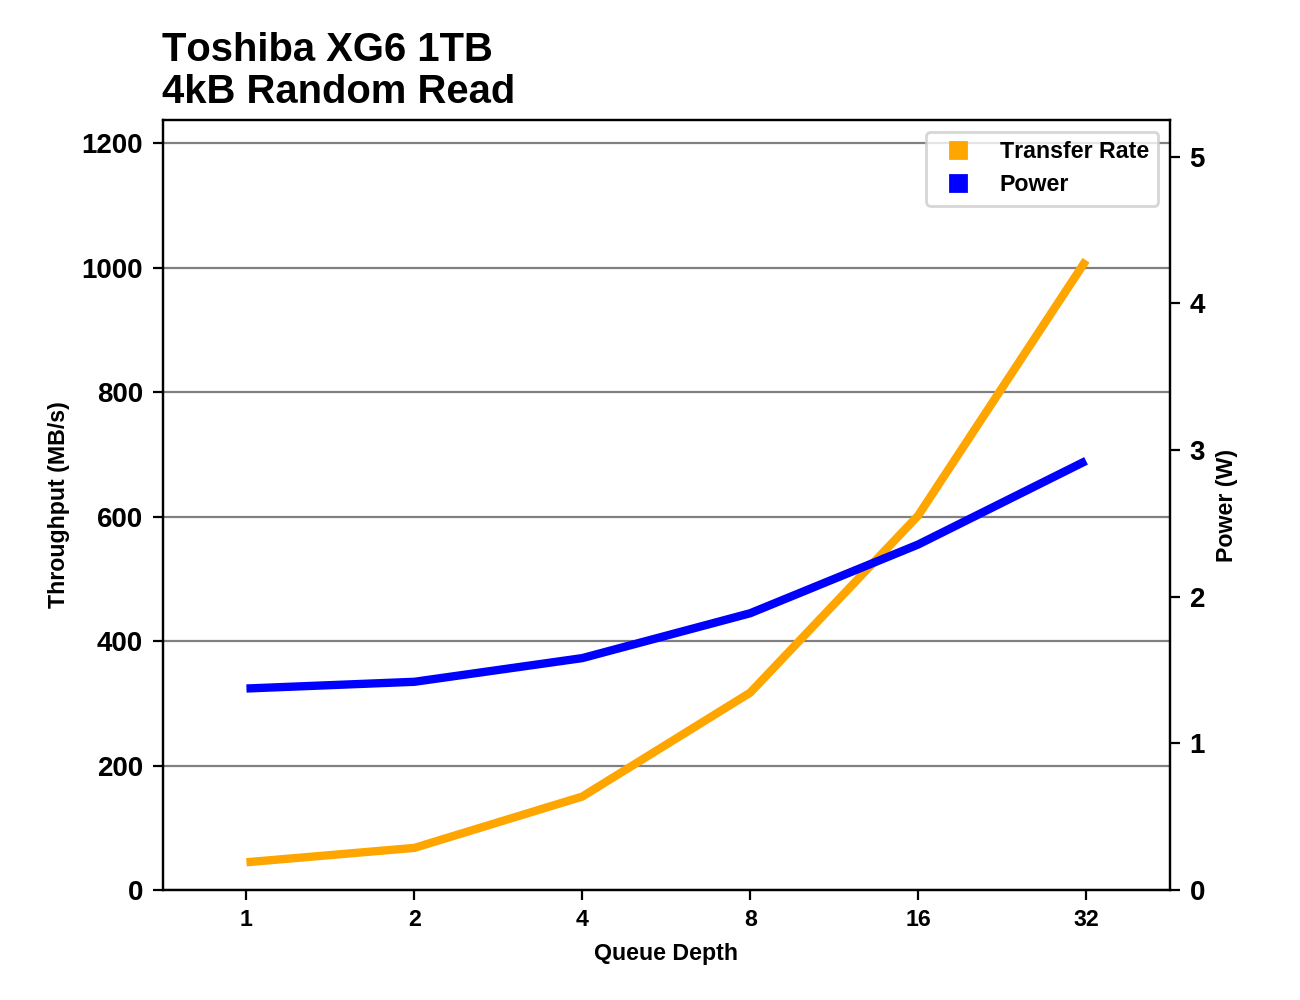
While the low queue depth random read performance from the Toshiba XG6 is nothing special, it does scale up quite well and by QD32 it has caught up with the SM2262EN and pulled ahead of all other TLC drives.
Random Write Performance
Our test of random write burst performance is structured similarly to the random read burst test, but each burst is only 4MB and the total test length is 128MB. The 4kB random write operations are distributed over a 16GB span of the drive, and the operations are issued one at a time with no queuing.
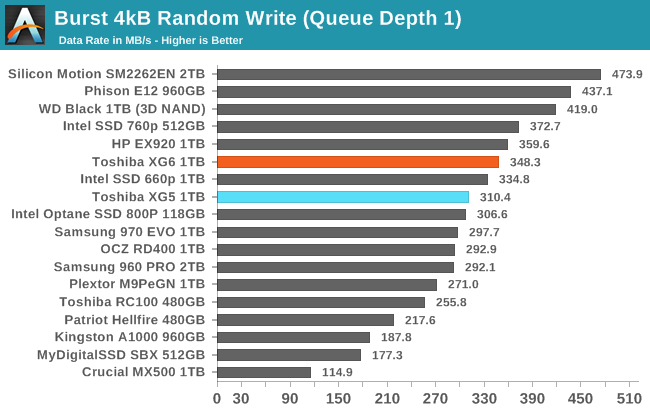
The burst random write performance of the Toshiba XG6 is about 12% faster than the XG5—not enough to catch up to the fastest drives, but enough to stay above average even as the standards for high-end performance climb from year to year.
As with the sustained random read test, our sustained 4kB random write test runs for up to one minute or 32GB per queue depth, covering a 64GB span of the drive and giving the drive up to 1 minute of idle time between queue depths to allow for write caches to be flushed and for the drive to cool down.
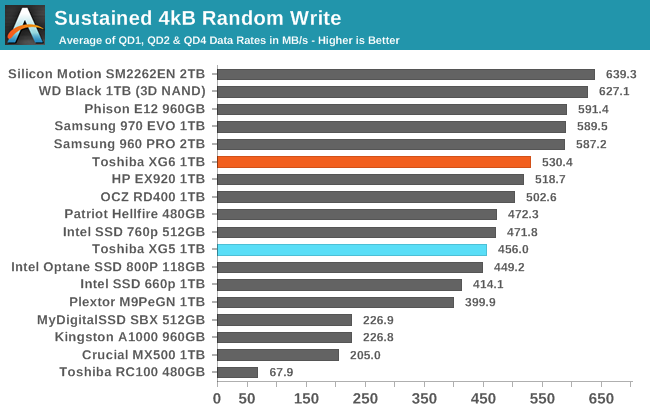
On the longer random write test, the Toshiba XG6 places at the top of the second tier of drives. It can't match the very fastest competitors, but it beats all the more mid-range NVMe drives.
 |
|||||||||
| Power Efficiency in MB/s/W | Average Power in W | ||||||||
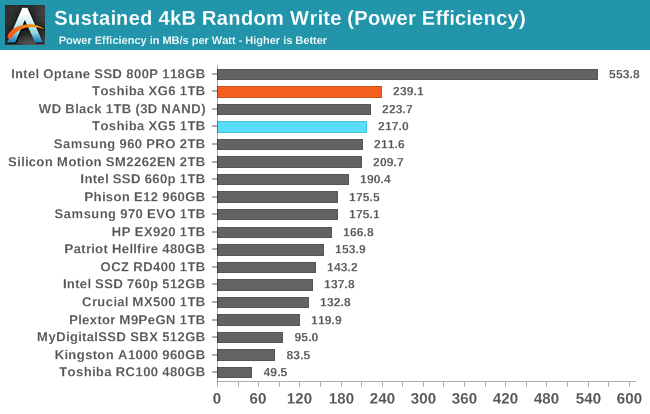
The XG6 has leapfrogged the WD Black to retake the lead in power efficiency during random writes, with about a 7% performance per Watt lead. Even with the improved performance relative to the XG5, the XG6 is is still one of the least power-hungry NVMe drives during this test.
 |
|||||||||
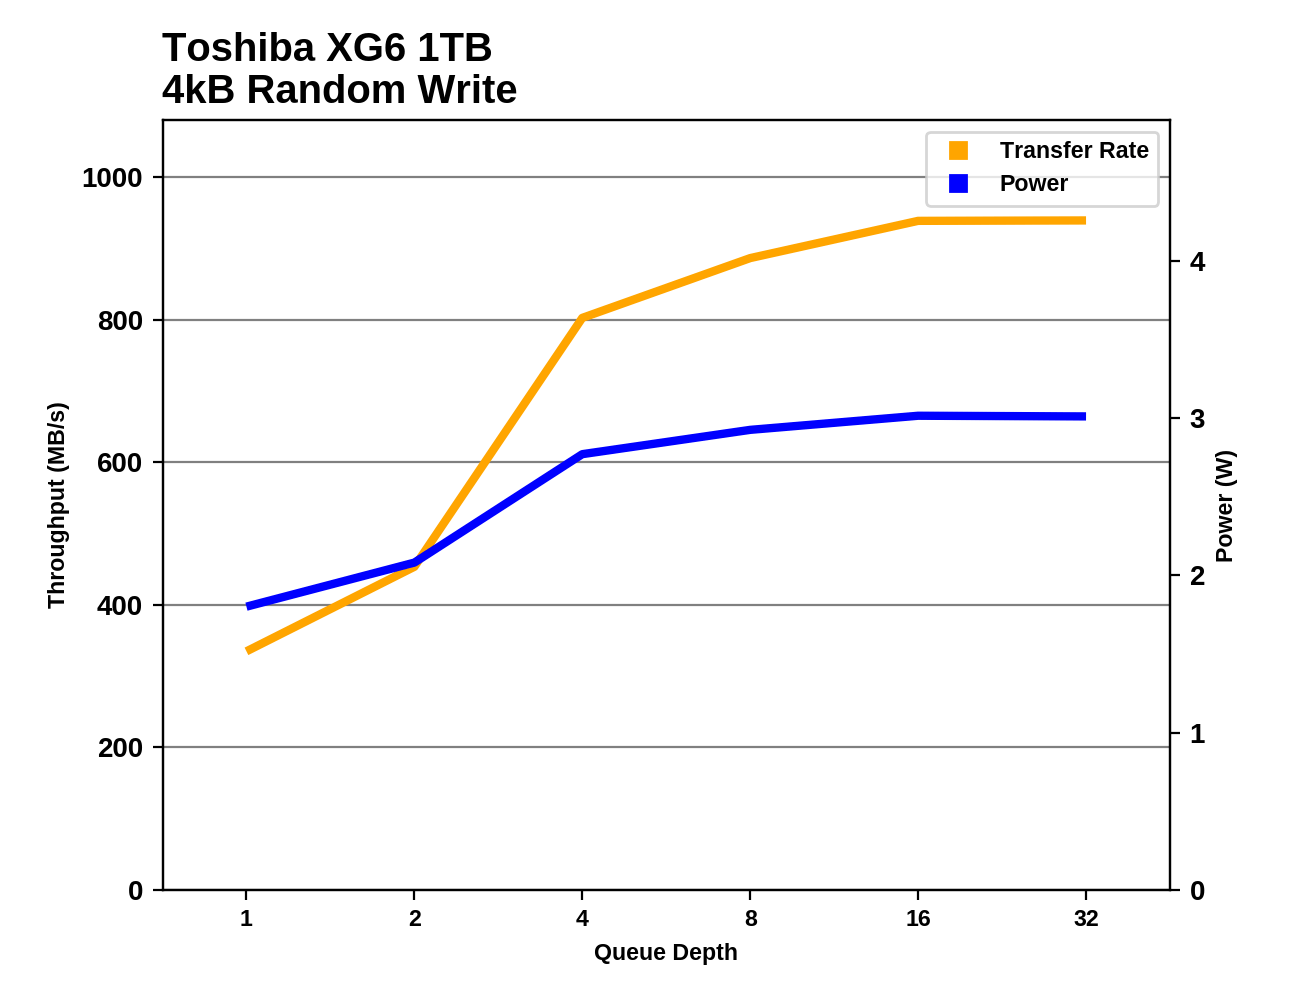
The random write performance of the XG6 scales best from QD2 to QD4 which brings it near saturation. This pattern is similar to the behavior of drives from Samsung, WD and the XG5, while the Phison and Silicon Motion controllers seem to pick up the pace a bit earlier with better QD2 performance.


31 Comments
View All Comments
Spoelie - Thursday, September 6, 2018 - link
2 short questions:- what happened to the plextor M9Pe, performance is hugely different from the review back in march.
- i know this is already the case for a year or so, but what happened to the perf consistency graphs, where can i deduce the same information from?
hyno111 - Thursday, September 6, 2018 - link
M9Pe had firmware updates, not sure if it's applied or related though.DanNeely - Thursday, September 6, 2018 - link
I don't recall the details, but something went wrong with generating the performance consistency data, and they were pulled pending finding a fix due to concerns they were no longer valid. IF you have the patience to dig through the archive, IIRC the situation was explained in the first review without them.Billy Tallis - Thursday, September 6, 2018 - link
I think both of those are a result of me switching to a new version of the test suite at the same time that I applied the Spectre/Meltdown patches and re-tested everything. The Windows and Linux installations were updated, and a few tweaks were made to the synthetic test configuration (such as separating the sequential read results according to whether the test data was written sequentially or randomly). I also applied all the drive firmware updates I could find in the April-May timeframe.The steady-state random write test as it existed a few years ago is gone for good, because it really doesn't say anything relevant about drives that use SLC caching, which is now basically every consumer SSD (except Optane and Samsung MLC drives). I also wasn't too happy with the standard deviation-based consistency metric, because I don't think a drive should be penalized for occasionally being much faster than normal, only much slower than normal.
To judge performance consistency, I prefer to look at the 99th percentile latencies for the ATSB real-world workload traces. Those tend to clearly identify which drives are subject to stuttering performance under load, without exaggerating things as much as an hour-long steady-state torture test.
I may eventually introduce some more QoS measures for the synthetic tests, but at the moment most of them aren't set up to produce meaningful latency statistics. (Testing at a fixed queue depth leads to the coordinated omission problem, potentially drastically understating the severity of things like garbage collection pauses.) At some point I'll also start graphing the performance as a drive is filled, but with the intention of observing things like SLC cache sizes, not for the sake of seeing how the drive behaves when you keep torturing it after it's full.
I will be testing a few consumer SSDs for one of my upcoming enterprise SSD reviews, and that will include steady-state full drive performance for every test.
svan1971 - Thursday, September 6, 2018 - link
I wish current reviews would use current hardware, the 970 Pro replaced the 960 Pro months ago.Billy Tallis - Thursday, September 6, 2018 - link
I've had trouble getting a sample of that one; Samsung's consumer SSD sampling has been very erratic this year. But the 970 Pro is definitely a different class of product from a mainstream TLC-based drive like the XG6. I would only include 970 Pro results here for the same reason that I include Optane results. They're both products for people who don't really care about price at all. There's no sensible reason to be considering a 970 Pro and an XG6-like retail drive as both potential choices for the same purchasing decision.mapesdhs - Thursday, September 6, 2018 - link
Please never stop including older models, the comparisons are always useful. Kinda wish the 950 Pro was in there too.Spunjji - Friday, September 7, 2018 - link
I second this. I know that I am (and feel most other savvy consumers would be) more likely to compare an older high-end product to a newer mid-range product, partly to see if it's worth buying the older gear at a discount and partly to see when there is no performance trade-off in dropping a cost tier.jajig - Friday, September 7, 2018 - link
I third it. I want to know if an upgrade is worth while.dave_the_nerd - Sunday, September 9, 2018 - link
Very much this. And not all of us upgrade our gear every year or two.