The Corsair SP (Static Pressure), AF (High Airflow) 120/140mm Fan Review
by E. Fylladitakis on November 25, 2015 8:00 AM ESTCorsair's 120mm Performance
The AF120 Performance and AF120 Quiet Edition
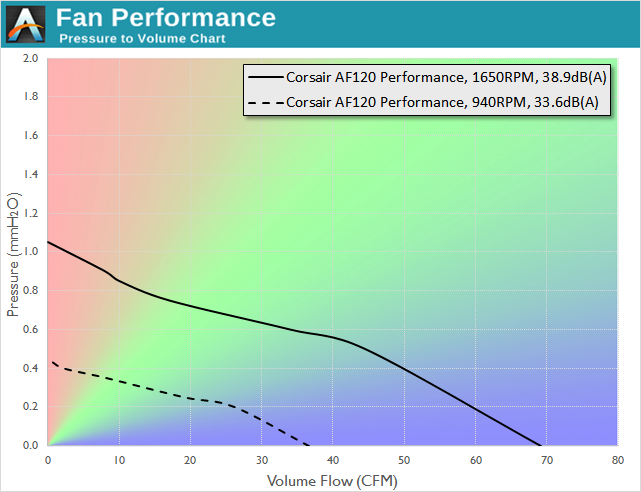
First one up is the 'High Airflow' variant of the 120mm line (non-LED), which comes in Performance and Quiet modes. This is the Performance variant pressure/volume response at 12V and 7V:
Whereas the quiet model has this response - note the axes are the same for both AF120 models in this case.
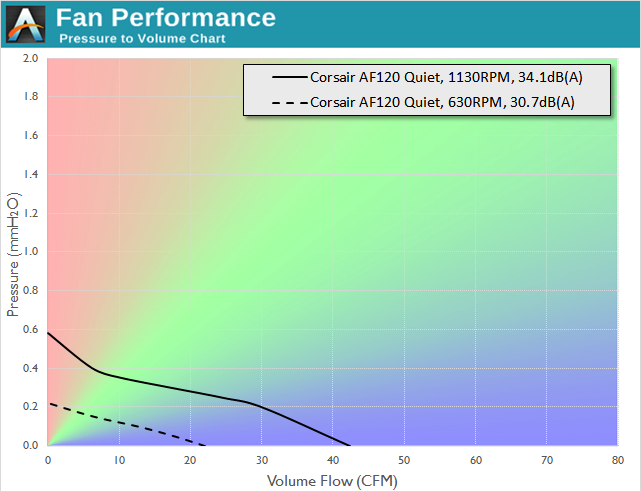
While both AF120 fans in the graphs above share the same shape and design, with the only difference being their rotational speed, the performance curves are of similar shape but different magnitude. The performance of the AF120 fans is low when the impedance is very high but their volume flow capacity greatly increases when the airflow impedance falls below medium levels.
The SP120 Performance and Quiet Edition
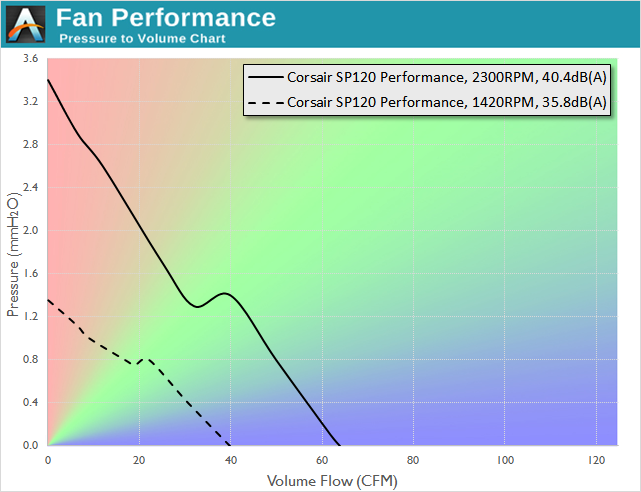
As we move onto the Static Pressure line of fans, featuring fewer but wider fan blades (only 7 vs 11), the expectations lie in higher airflow in high-impedance (dense liquid cooler) scenarios. First up, the Performance model at 12V and 7V:
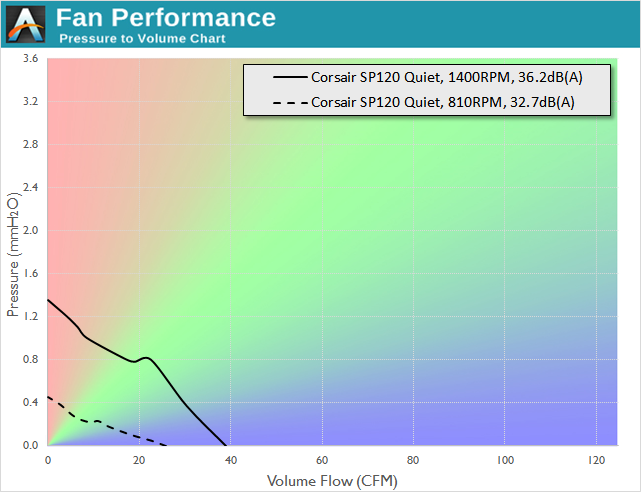
The Quiet model has reduced fan speeds, which gives a very different graph:
The performance of the SP120 is obviously much different than the AF120, as expected, but is also very different from the performance of the SP140 LED as well. The Performance Edition of the SP120 has an outrageous maximum speed of 2300 RPM and our instruments recorded an outstanding static pressure of 3.42 mmH2O at that speed. The curve declines sharply, with the SP120 displaying mediocre airflow gains as the airflow impedance decreases. It also has a significant stall area within the medium airflow impedance region.
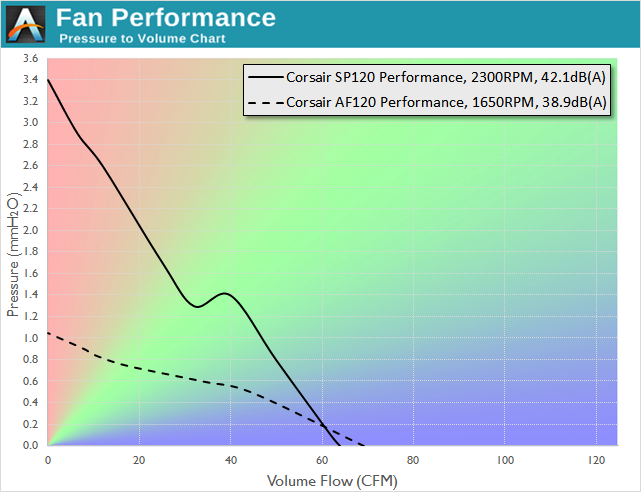
The SP120 Perfomance and AF120 Performance Comparison
As the speed of the SP120 Performance Edition at 7 Volts and the maximum speed of the SP120 Quiet Edition coincide, it can be noticed that the two fans have an almost identical performance curve when operating at the same speed. This is natural as only the rotational speed of the fans differs, the design of the fan itself is identical. But when we compare the SP120 and AF120 variants to each other, we get the following (again, at 12V and 7V)
And in the Quiet versions (note, different axes):
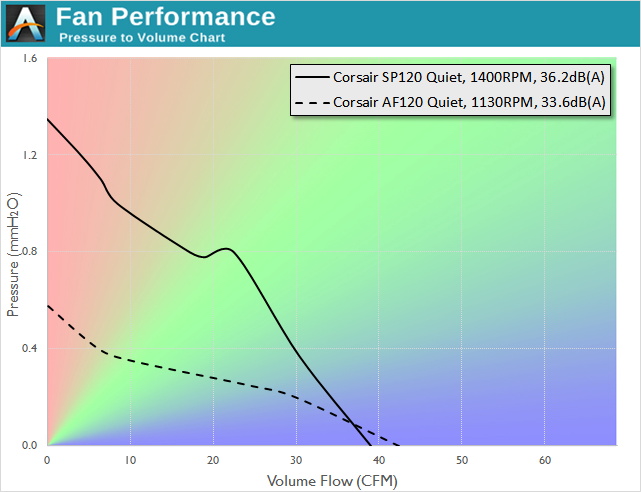
The above two comparisons between the Performance and Quiet versions of the SP120 and AF120 respectively are somewhat unfair. From just a quick look at the graphs, it appears that the SP120 outperforms the AF120 under almost any conditions when both fans are operating at their maximum stock speeds. That however is not correct, as the SP120 versions have a much higher top speed are are in both cases louder. With both the AF120 and the SP120 running at the same speed (and similar noise profiles) we got the following performance curves.
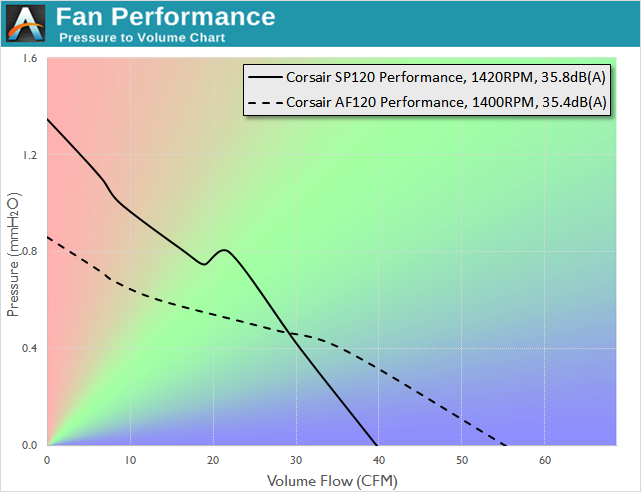
With both fans running at the same speed, the advantages and disadvantages of each design become more apparent. The AF120 provides higher air volume flow in low airflow impedance setups while the SP120 can maintain higher air volume flow levels when the airflow impedance is high. Strangely, even though the SP120 is moving considerably less air while entirely unobstructed, it generates about the same level of noise as the AF120. We can only assume that the large blades of the SP120 generate a very turbulent air flow.


92 Comments
View All Comments
Ian Cutress - Wednesday, November 25, 2015 - link
Sorry, that was my bad. I edited a few things and got mixed up. The definition now reads 'one Pascal is the pressure required to accelerate 1 kg of mass at a speed of 1 meters per second squared per square meter'. Admittedly it's a bit clunky, but it's the best way (from my perspective) to visualize it.nutral - Thursday, November 26, 2015 - link
It kind of says that 1 pascal is still the pressure required to accelerate 1 kg of mass over an area, i would just keep it at 1 pascal is equal to 1 newton per square meter. the gravity acting on 1 kg is 9,81 newton.Arbie - Wednesday, November 25, 2015 - link
If you're starting on fans, check out the old X-Bit Labs site. They had very thorough reviews which helped a lot in balancing noise vs cooling performance for different applications. Here's a link to that section:http://www.xbitlabs.com/articles/coolers/
They haven't published in a year, but fortunately the material is still available. Sad to see them quit...
sheh - Wednesday, November 25, 2015 - link
Thanks for the interesting review.It might help if there was a way to summarize the results in a more condensed manner. I don't have an ideal solution, but perhaps overlay more results in a single graph.
It would help if the voltage was specified in the graphs, and not only the RPM.
Some basic details are missing on the fans: startup voltage, "cruise" voltage, official specs (would be interesting to see even if somewhat arbitrary).
It would be nice to see more detailed noise-vs-RPM/voltage figures.
BTW, parts of some of the graph images are blurry. Anandtech's become much less consistent in the visual looks of graphs, and with occasional hiccups in quality. Also the frequent low quality JPEGs in the homepage make it less polished than it used to be.
britjh22 - Wednesday, November 25, 2015 - link
Great technical analysis as always on this site. I'd just recommend one addition, a real world test. It would be very interesting to take a standardized test bench, let's say an overclocked i7, and have a 240mm AIO solution and an air cooler. It would be great to be able to see the actual effect on the temps by just changing fans, and would give a great data point for user value analysis. Being able to see how a fan statistically performs is great, but the real world effect vs. cost is what I would LOVE to see.lorribot - Wednesday, November 25, 2015 - link
Whilst i love all the technical stuff all the graphs don't really help me decide which fans i should be buying for my case and radiator. What I need is some specifics such as fan a will need to run at x000 rpm to cool a 200w processor to 60C and produce xdb at that point. That would be a repeatable real world test that had some meaning. For case fans you need some form of test for rpm and db for each fan to provide a specific airflow that would be need for something like the above load plus a Graphics card.A separate article on the differences a case design can make to noise and fan performance would be good, especially the difference a grill would have over a perforated sheet metal.
Oxford Guy - Thursday, November 26, 2015 - link
"all the graphs don't really help me decide which fans i should be buying for my case and radiator"What you meant to say is that it doesn't tell you everything you want to know to make informed choices.
Oxford Guy - Thursday, November 26, 2015 - link
One thing that most people don't take into account are the frequencies emitted from fans. I know it's a lot to ask but it could be nice to see the spectrum for fans that are tested. Typically, more decibels in lower frequencies is more pleasant, and less likely to aggravate tinnitus, than more in shriller ones.nutral - Thursday, November 26, 2015 - link
The graphs are a bit confusing, especially with the colours. And did there have to be so many? Impedance in this case is not the correct term, because that applies to the impedance it has to changing air flow, in this case it is resistance. (like in electricity, resistance vs impedance, where impedance is used for AC)I would really rather use Pascal instead of mmH2O and m3/h instead of cfm but i guess that is your choice, having 1 imperial and 1 metric measurement is a bit strange though. 1mmH2O or 9,81 pascal is equal to about 1 meter of air column head. The left legend also should say static pressure instead of just pressure, because the pressure is a compination of static and velocity.
The graphs are called Pressure/flow, using volume is the incorrect term, as it is not talking about the volume but the actual displacement of air.
I was thinking of making a test setup myself for testing fans and their pressure/flow curves. How did you setup your apperatus to restrict air flow and test at different static pressures?
It would be really nice to have a simple module on the website, that puts the graphs of fans and graphs of different components like radiators and cpu coolers over each other to see what the best performance would be.
kalboston - Thursday, November 26, 2015 - link
All in all, an excellent article with very informative information. I am also not use to seeing performance/fan curves presented this way but I am able to understand what the author was trying to convey.Typically in the US, airflow is measured by CFM (Cubic Feet Minute) and In H2O (Inches Of Water Column/Gauge) or M/S (Cubic Meters per Second) and Pascals.
I do agree mixing imperial and SI units is not typical, but there are plenty of applications in the real world that this is done.
I do believe the author tried to perform a controlled test based upon his other articles and methodology. Without knowing the test setup and techniques used, there is always questions that could potentially affect the results. I for one would not have used a pitot tube, most likely a thermal anemometer. A very accurate test setup for airflow is a lot of money for a tech review site that would most likely never recoup the cost.
End result was a great amount of time by the author testing multiple units with many potential variables and presenting the data in a way that they felt was appropriate. For that I am greatly appreciative of, it was an excellently presented piece taking their perspective into account.
I have no college education, although I do have almost 10 years of Biotech and Semi Conductor Cleanroom Certification and Balancing.
I also learned something a long time ago about engineers summed up to a saying I saw "Arguing with an engineer is like wrestling a pig, after awhile your realize they enjoy it"