The Intel Skylake i7-6700K Overclocking Performance Mini-Test to 4.8 GHz
by Ian Cutress on August 28, 2015 2:30 PM ESTConclusions
The how, what and why questions that surround overclocking often result in answers that either confuse or dazzle, depending on the mind-set of the user listening. At the end of the day, it originated from trying to get extra performance for nothing. Buying the low-end, cheaper processors and changing a few settings (or an onboard timing crystal) would result in the same performance as a more expensive model. When we were dealing with single core systems, the speed increase was immediate. With dual core platforms, there was a noticeable difference as well, and overclocking gave the same performance as a high end component. This was noticeable particularly in games which would have CPU bottlenecks due to single/dual core design. However in recent years, this has changed.
Intel sells mainstream processors in both dual and quad core flavors, each with a subset that enable hyperthreading and some other distinctions. This affords five platforms – Celeron, Pentium, i3, i5 and i7 going from weakest to strongest. Overclocking is now enabled solely reserved for the most extreme i5 and i7 processors. Overclocking in this sense now means taking the highest performance parts even further, and there is no recourse to go from low end to high end – extra money has to be spent in order to do so.
As an aside, in 2014, Intel released the Pentium G3258, an overclockable dual core processor without hyperthreading. When we tested, it overclocked to a nice high frequency and it performed in single threaded workloads as expected. However, a dual core processor is not a quad core, and even with a +50% increase in frequency, it will not escape a +100% or +200% increase in threads over the i5 or i7 high end processors. With software and games now taking advantage of multiple cores, having too few cores is the bottleneck, not frequency. Unfortunately you cannot graft on extra silicon as easily as pressing a few buttons.
One potential avenue is to launch an overclockable i3 processor, using a dual core with hyperthreading, which might play on par with an i5 even though we have hyperthreads compared to actual core count. But if it performed, it might draw away sales from the high end overclocking processors, and Intel does not have competition in this space, so I doubt we would see it any time soon.
But what exactly does overclocking the highest performing processor actually achieve? Our results, including all the ones in Bench not specifically listed in this piece, show improvements across the board in all our processor tests.
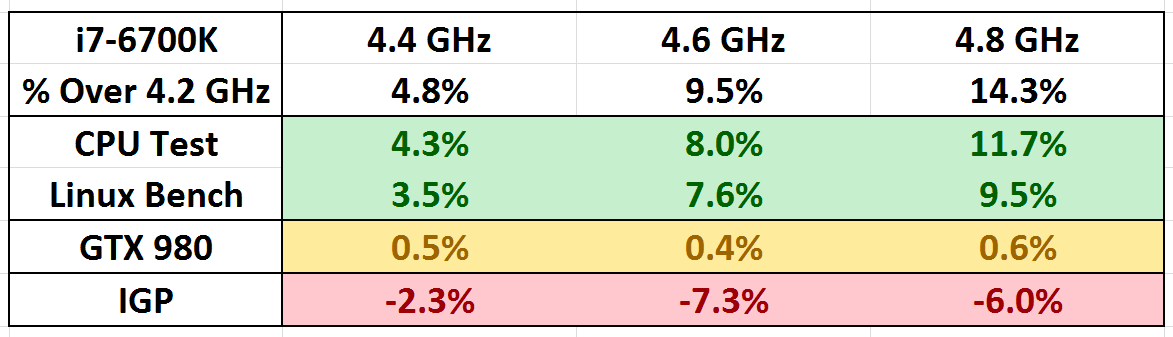
Here we get three very distinct categories of results. The move of +200 MHz is rounded to about a 5% jump, and with our CPU tests it is more nearer 4% for each step up and slightly less in our Linux Bench. In both of these there were benchmarks that bought the average down due to other bottlenecks in the system: Photoscan Stage 2 (the complex multithreaded stage) was variable and in Linux Bench both NPB and Redis-1 gave results that were more DRAM limited. Remove these and the results get closer to the true % gain.
Meanwhile, all of our i7-6700K overclocked testing are now also available in Bench, allowing direct comparison to other processors. Other CPUs when overclocked will be updated in due course.
Moving on, with our discrete testing on a GTX 980, our series of games had little impact on increased frequency at 1080p or even SoM at 4K. Some might argue that this is to be expected, because at high settings the onus is more on the graphics card – but ultimately with a GTX 980 you would be running at 1080p or better at maximum settings where possible.
Finally, the integrated graphics results are a significantly different ball game. When we left the IGP at default frequencies, and just overclocked the processor. The results give a decline in average frame rates, despite the higher frequency, which is perhaps counterintuitive and not expected. The explanation here is due to power delivery budgets – when overclocked, the majority of the power pushes through to the CPU and items are processed quicker. This leaves less of a power budget within the silicon for the integrated graphics, either resulting in lower frequencies to maintain the status quo or by the increase in graphical data occurring over the DRAM-to-CPU bus causing a memory latency bottleneck. Think of it like a see-saw: when you push harder on the CPU side, the IGP side effect is lower. Normally this would be mitigated by increasing the power limit on the processor as a whole in the BIOS, however in this case this had no effect.
When we fixed the integrated graphics frequencies however, this issue disappeared.
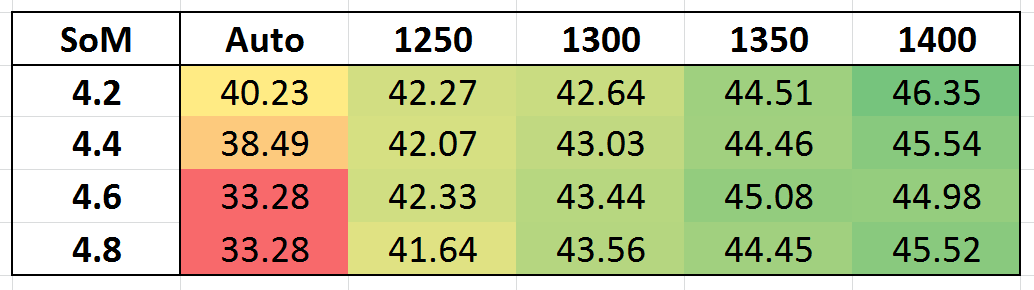
Taking Shadow of Mordor as the example, raising the graphics frequency not only gave a boost in performance when we used the presets provided on the ASRock motherboard, but also the issue of balancing power between the processor and the graphics disappeared and our results were within expected variance.


103 Comments
View All Comments
StrangerGuy - Sunday, August 30, 2015 - link
If we keep dropping the OC multi on Skylake we are going into single-digit clock increases territory from 4GHz stock :)Yeah, I wonder why AT mentioned in their Skylake review about why people are losing interest in OCing despite Intel's claims of catering to it. From the looks of it, their 14nm process simply isn't tuned for 4GHz+ operation but towards the lower clocked but much more lucrative chips for the server and mobile segment.
qasdfdsaq - Wednesday, September 2, 2015 - link
Then you are deluded. There are edge cases and scenarios that will cause a hardware crash on a Xeon server with ECC RAM at stock speeds, so by your reckoning *nothing* is ever 100% stable.danjw - Friday, August 28, 2015 - link
When can we expect a platform overview? You reviewed the i7-6700K, but you didn't have much in details about them. You were expecting that from IDF. IDF is over, so is there an ETA?MrBowmore - Friday, August 28, 2015 - link
+1hansmuff - Friday, August 28, 2015 - link
I assume the POV-Ray score is the "Render averaged PPS"?My 2600K @4.4 gets 1497 PPS, so a 35% improvement compared to 6700k @4.4
hansmuff - Friday, August 28, 2015 - link
And of course I mean the 6700k seems to be 35% faster in POV... sigh this needs an edit buttonlooncraz - Saturday, August 29, 2015 - link
POV-Ray has been seeing outsized performance improvements on Intel.From Sandy Bridge to Haswell sees a 20% improvement, when the overall improvement is closer to 13%.
HandBrake improved even more - a whopping 29% from Sandy Bridge to Haswell.
And, of course, I'm talking core-for-core, clock-for-clock.
I suspect much of this improvement is related to the AVX/SIMD improvements.
Just hope AMD focused on optimizing for the big benchmark programs as well as their server target market with Zen (this is past tense since Zen is being taped out and currently being prototyped.. rumors and some speculation, of course, but probably pretty accurate).
zepi - Sunday, August 30, 2015 - link
One has to remember, that "handbrake" doesn't actually use CPU-resources at all. The process that is actually benchmarked is running x264 codec with certain settings easily accessible by using GUI called handbrake.If x264 or x265 programmers create new codepaths inside the codecs that take benefit of new architecture, it received huge performance gains. But what this actually means is that Sandy Bridge and Skylake actually run different benchmarks with different instructions fed to processors.
Do I care? No, because I just want my videos to be transcoded as quickly as possible, but one should still remember that this kind of real world benchmarks don't necessarily run same workloads on different processors.
MrBowmore - Friday, August 28, 2015 - link
When are you going to publish the runthrough of the architechture?! Waiting impatiently! :)NA1NSXR - Friday, August 28, 2015 - link
Sigh, still no BCLK comparisons at same clocks. What would really answer some unanswered questions would be comparing 100 x 40 to 200 x 20 for example.