The Mobile CPU Core-Count Debate: Analyzing The Real World
by Andrei Frumusanu on September 1, 2015 8:00 AM EST- Posted in
- Smartphones
- CPUs
- Mobile
- SoCs
S-Browser - AnandTech Frontpage
Again staying with the S-Browser, we check the behaviour of just pure web-page rendering. This time we load the AnandTech front-page without scrolling through the page. The page is slightly heavier as we have more graphical elements as opposed to text on the previous article page.
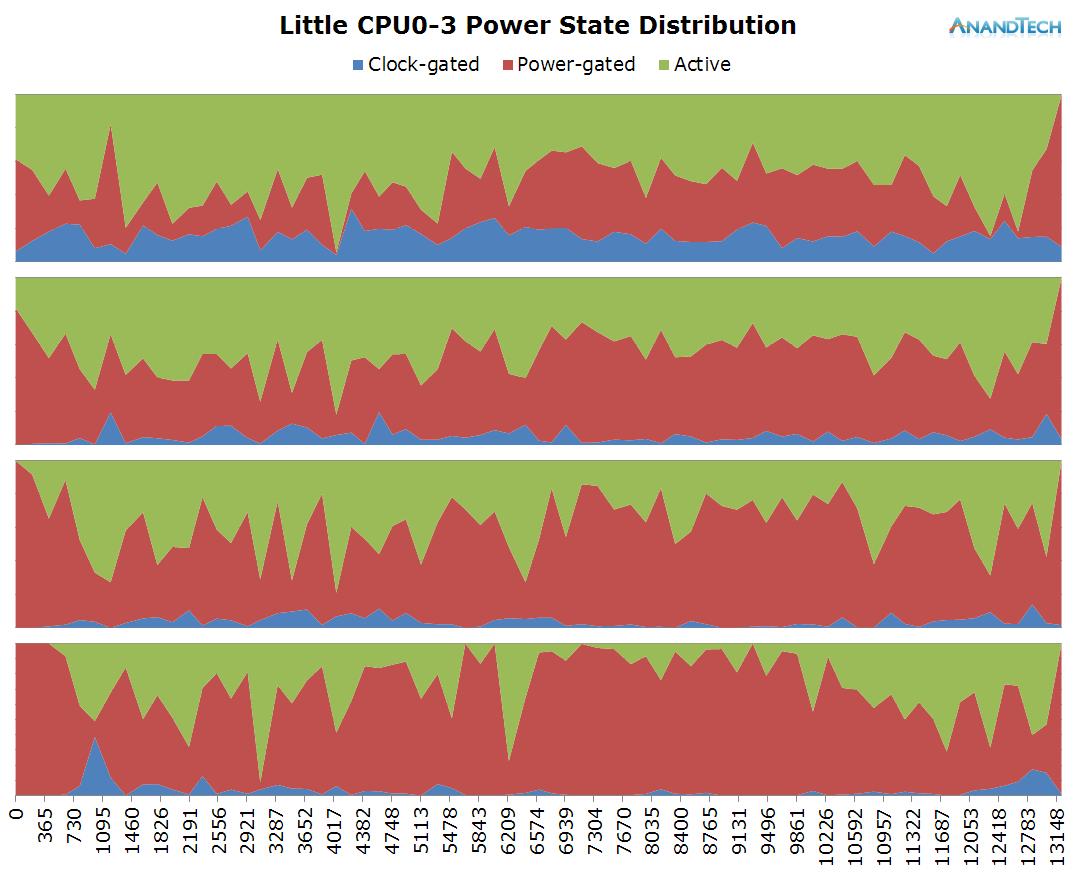
This time around, we a more even distribution of the load on the little cores. Again, most of the 4 CPU cores are active and have threads placed onto them, averaging about 2.5 fully loaded cores.
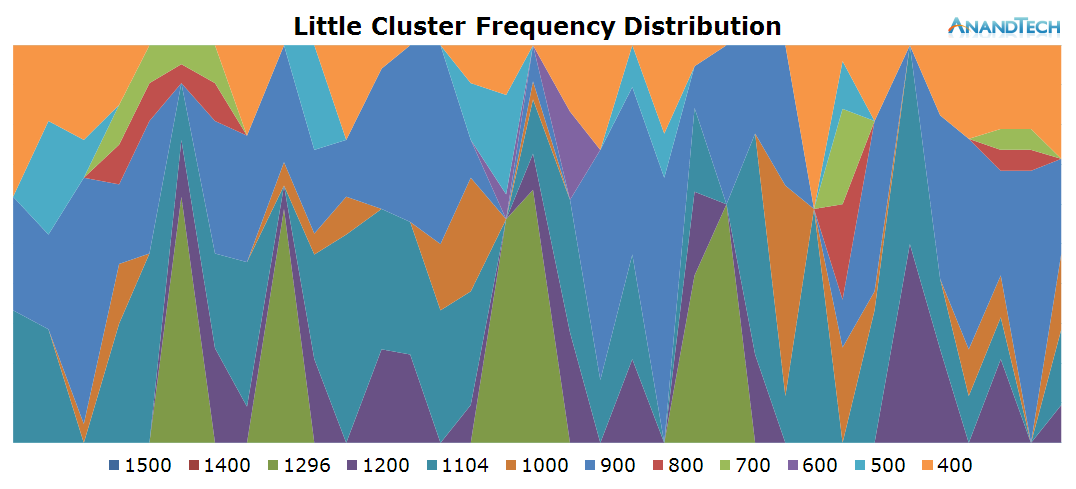
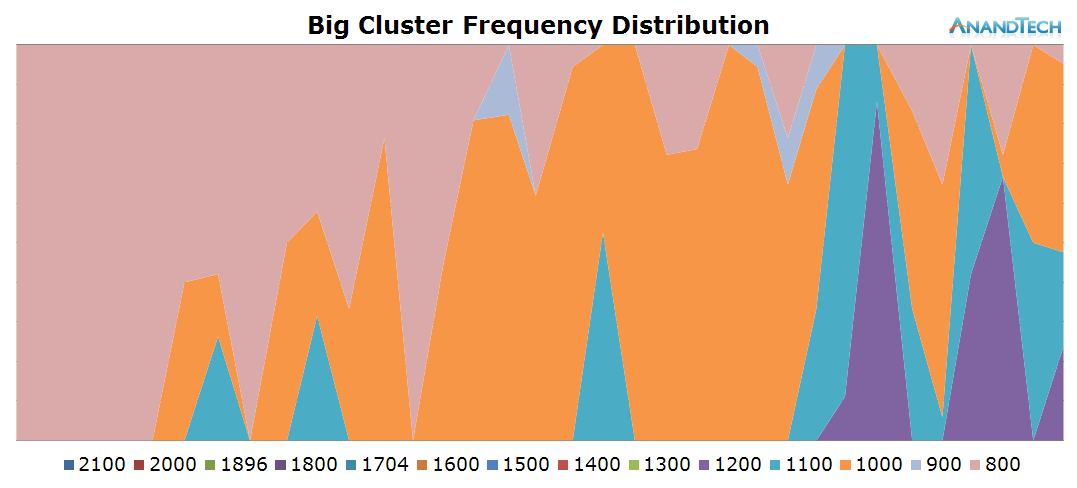
The frequency distribution is much more variable in this scenario, as the cluster makes wide usage of the frequency range available to itself. On the power state distribution chart we see that most CPUs are still able to enter their power-gating states, indicating that we're mostly handling very short bursty loads.
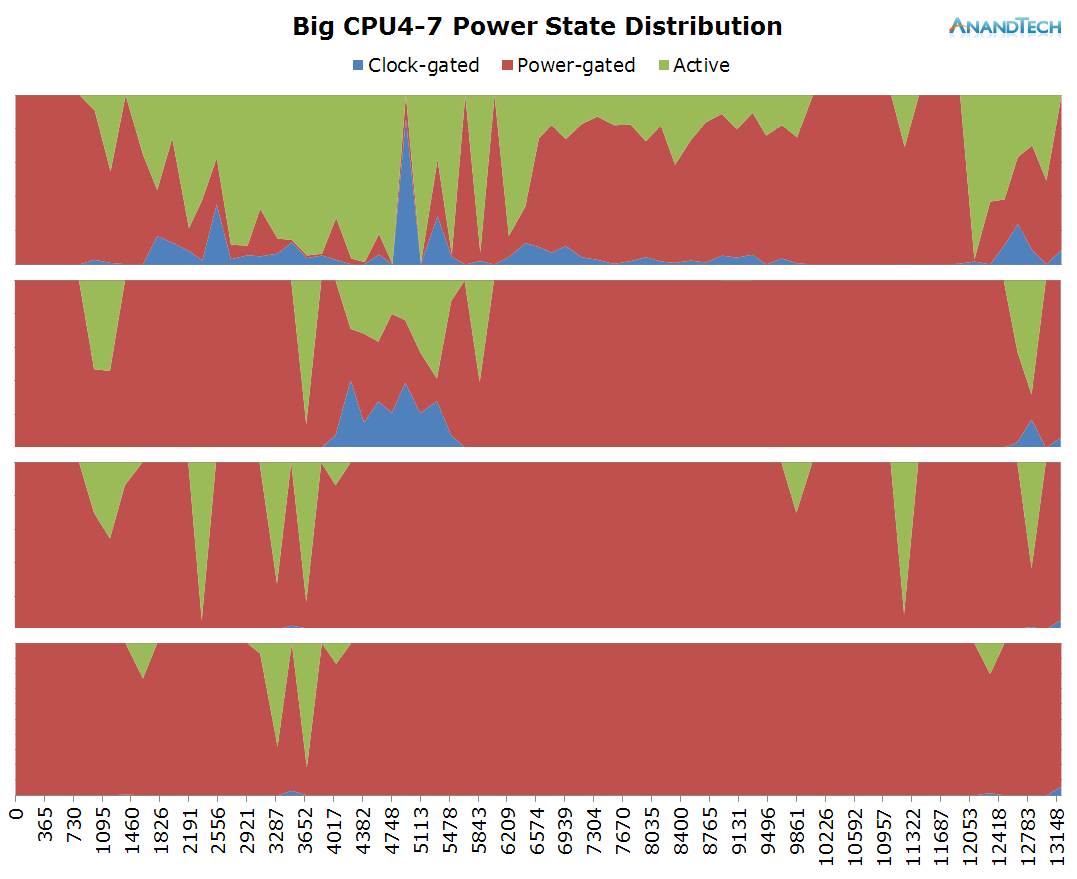
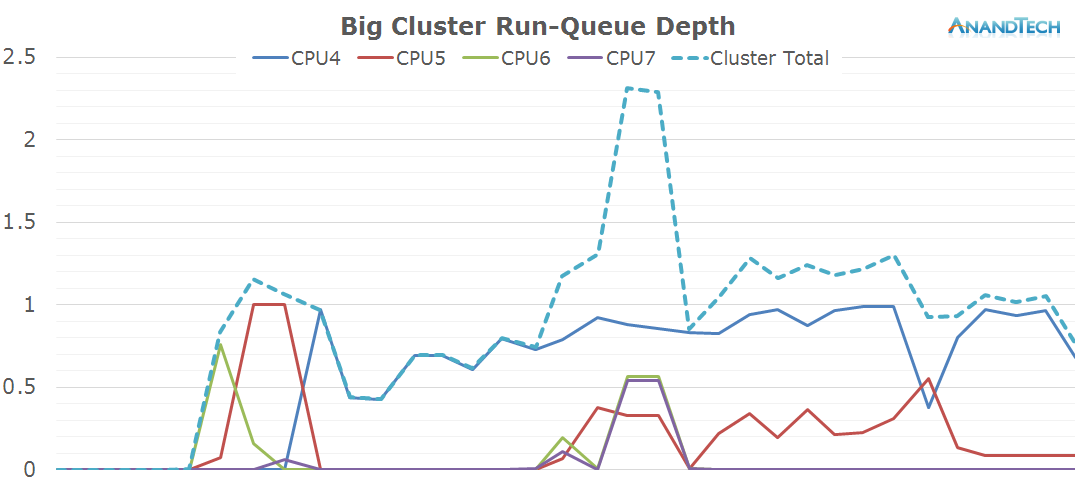
The biges cores seems much less loaded in this scenario, as most of the time except for a small peak we only have 1 large thread loading the cluster. Because of this, we expect the other cores to be shut down and if we look at the power state distribution we guessed correctly.
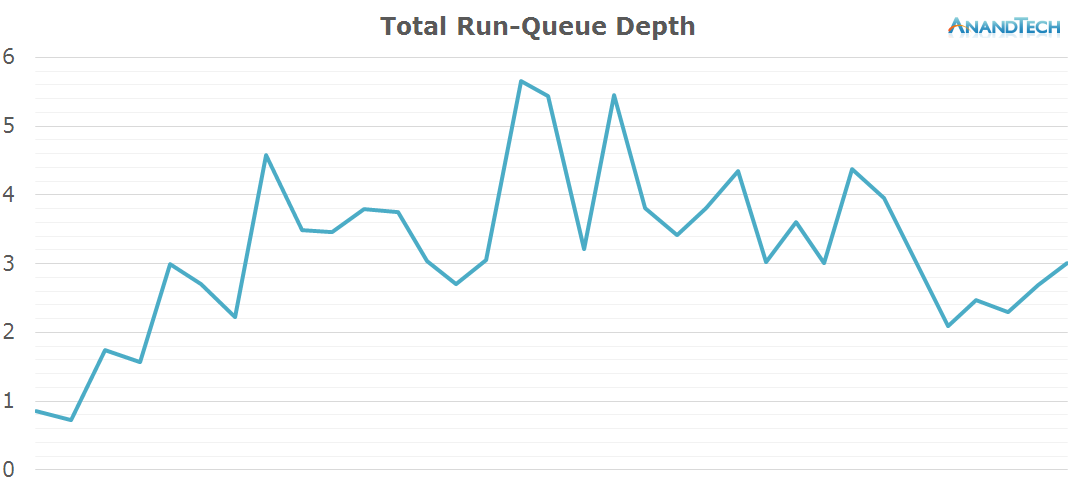
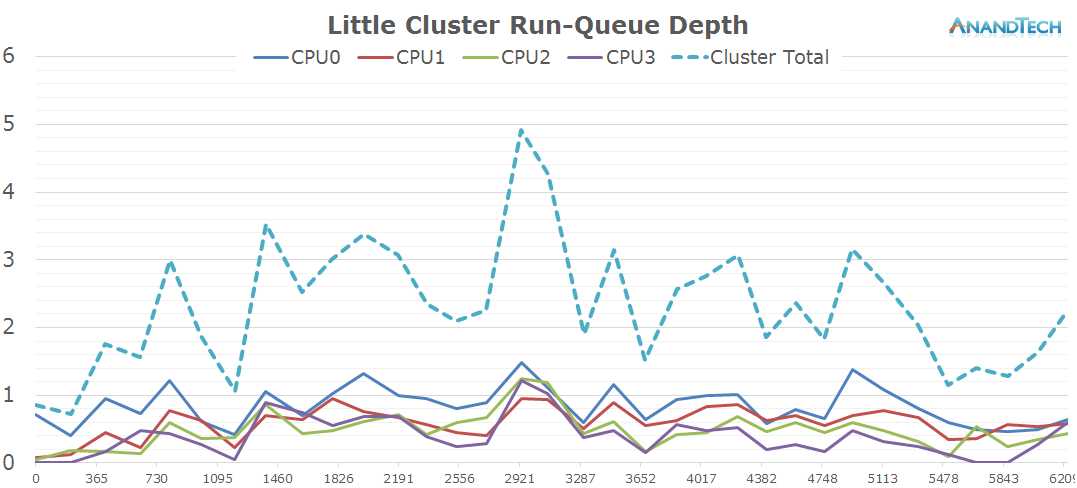
The total amount of threads on the system doesn't change much compared to the previous scenario: The S-Browser still manages to actively make good use of up to 4 cores with the occasional burst of up to 5 threads.


157 Comments
View All Comments
Gigaplex - Thursday, September 3, 2015 - link
An interesting and thorough analysis, although I'm concerned at some of the assumptions made in some of the conclusions. Just because a queue of 4 threads makes all the 8 big.LITTLE cores active doesn't mean that the architecture is effective. For all we know, the threads are thrashing back and forth, draining precious performance per watt.darkich - Friday, September 4, 2015 - link
Andrei, your articles are in a league of their own. Thanks for the great workmelgross - Thursday, September 10, 2015 - link
I'm still not convinced. The fact that it's doing what it does on these chips doesn't mean that their performance is as good as it could be, or that power efficiency is as good. We really need to see two to four core designs, with cores that are really more powerful, to make a proper comparison. We don't have that with the chips tested.blackcrayon - Thursday, October 8, 2015 - link
Exactly. It should at least show a design with a small number of powerful cores. Obviously with Apple's A series chips you have the issue of dealing with a different operating system underneath, but can't they use a Tegra K1 or something?Hydrargyrum - Friday, September 25, 2015 - link
The stacked frequency distribution graphs would be a *lot* easier to read if you used a consistent range of different saturations/intensities of a single colour (e.g. go from bright=fast to dark=slow), or a single pass from red to blue through the ROYGBIV colour spectrum (e.g. red=fast, blue=slow), to represent the range of frequencies.By going around the colour wheel multiple times in the colour coding it's *really* hard to tell whether a given area of the graph is high or low frequency. The difference in colour between 1400/800, 1296/700, and 1200/600 are very subtle to say the least.
Ethos Evoss - Thursday, November 12, 2015 - link
anandtech always uses weird non-popular words on its own site type ''heterogeneous '' never heard in my life and even usa or uk ppl have to search in cambridge/oxford dictionary :DDDImmediately u can say it is DEFO NOT USA or UK website.. They do not use such difficult words AT ALL :)
Ethos Evoss - Thursday, November 12, 2015 - link
ANd mainly they use when it comes to china products .. like mediatek or kirin or big.little topic etc..This site is DEVOURED or we could say powered by apple.inc :)