The AMD Radeon R9 Fury Review, Feat. Sapphire & ASUS
by Ryan Smith on July 10, 2015 9:00 AM ESTCompute
Shifting gears, we have our look at compute performance. As compute performance will be more significantly impacted by the reduction in CUs than most other tests, we’re expecting the performance hit for the R9 Fury relative to the R9 Fury X to be more significant here than under our gaming tests.
Starting us off for our look at compute is LuxMark3.0, the latest version of the official benchmark of LuxRender 2.0. LuxRender’s GPU-accelerated rendering mode is an OpenCL based ray tracer that forms a part of the larger LuxRender suite. Ray tracing has become a stronghold for GPUs in recent years as ray tracing maps well to GPU pipelines, allowing artists to render scenes much more quickly than with CPUs alone.
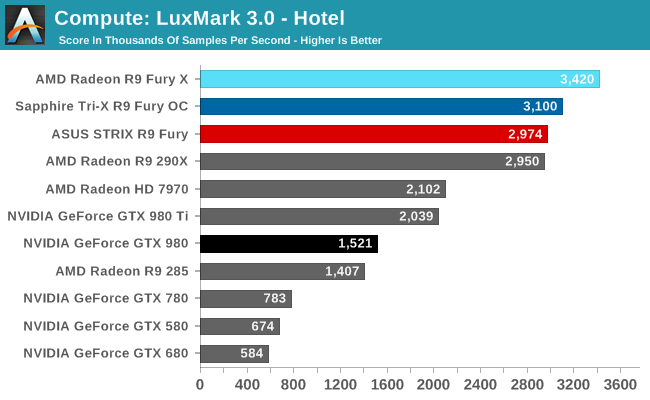
For LuxMark with the R9 Fury X already holding the top spot, the R9 Fury cards easily take the next two spots. One interesting artifact of this is that the R9 Fury’s advantage over the GTX 980 is actually greater than the R9 Fury X’s over the GTX 980 Ti’s, both on an absolute and relative basis. This despite the fact that the R9 Fury is some 13% slower than its fully enabled sibling.
For our second set of compute benchmarks we have CompuBench 1.5, the successor to CLBenchmark. CompuBench offers a wide array of different practical compute workloads, and we’ve decided to focus on face detection, optical flow modeling, and particle simulations.
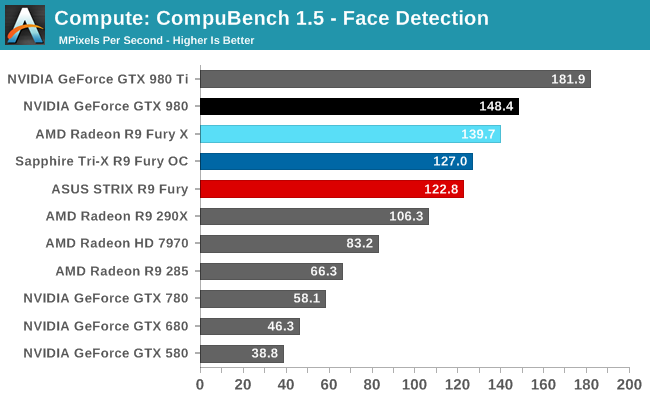
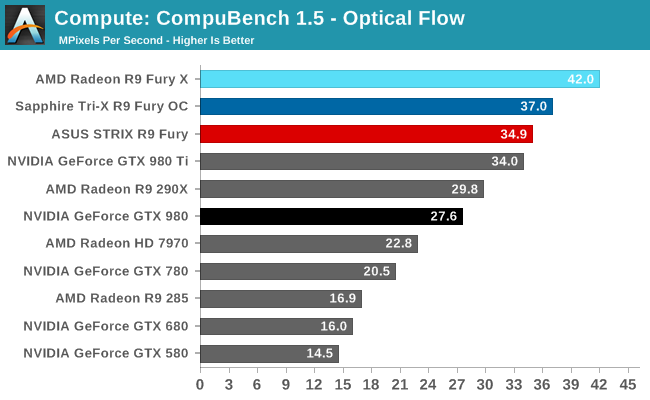
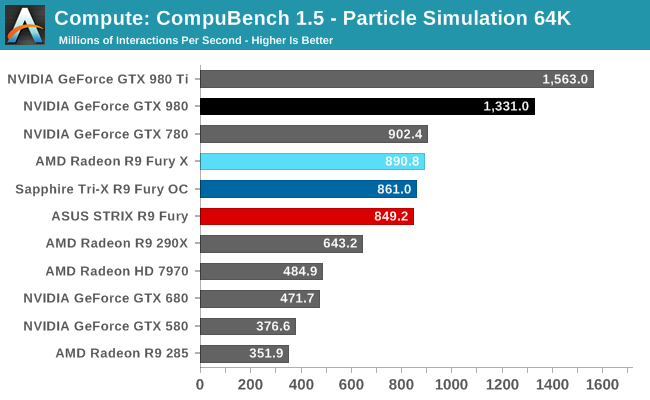
Not unlike LuxMark, tests where the R9 Fury X did well have the R9 Fury doing well too, particularly the optical flow sub-benchmark. The drop-off in that benchmark and face detection is about what we’d expect for losing 1/8th of Fiji’s CUs. On the other hand the particle simulation benchmark is hardly fazed beyond the clockspeed drop, indicating that the bottleneck lies elsewhere.
Our 3rd compute benchmark is Sony Vegas Pro 13, an OpenGL and OpenCL video editing and authoring package. Vegas can use GPUs in a few different ways, the primary uses being to accelerate the video effects and compositing process itself, and in the video encoding step. With video encoding being increasingly offloaded to dedicated DSPs these days we’re focusing on the editing and compositing process, rendering to a low CPU overhead format (XDCAM EX). This specific test comes from Sony, and measures how long it takes to render a video.
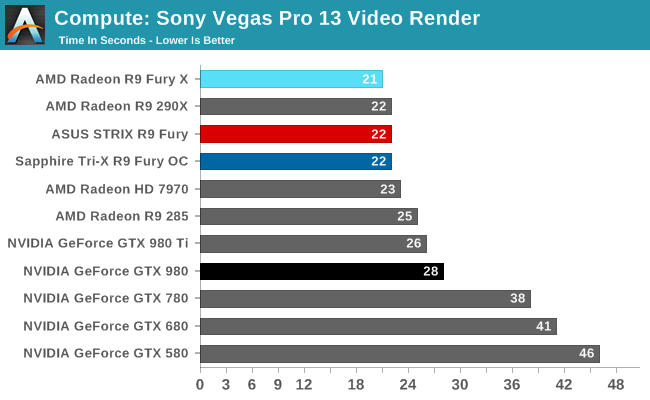
At this point Vegas is becoming increasingly CPU-bound and will be due for replacement. The R9 Fury comes in one second behind the chart-topping R9 Fury X, at 22 seconds.
Moving on, our 4th compute benchmark is FAHBench, the official Folding @ Home benchmark. Folding @ Home is the popular Stanford-backed research and distributed computing initiative that has work distributed to millions of volunteer computers over the internet, each of which is responsible for a tiny slice of a protein folding simulation. FAHBench can test both single precision and double precision floating point performance, with single precision being the most useful metric for most consumer cards due to their low double precision performance. Each precision has two modes, explicit and implicit, the difference being whether water atoms are included in the simulation, which adds quite a bit of work and overhead. This is another OpenCL test, utilizing the OpenCL path for FAHCore 17.
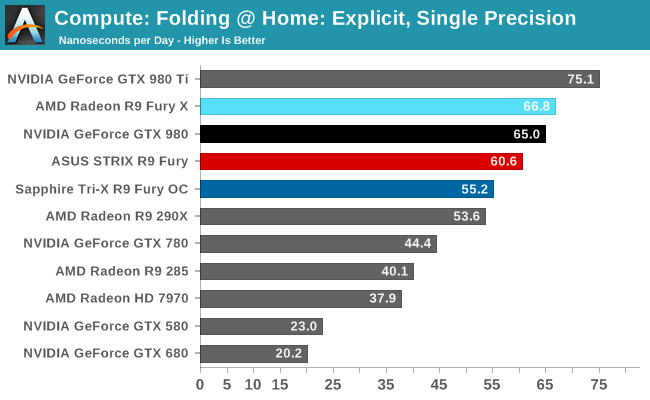
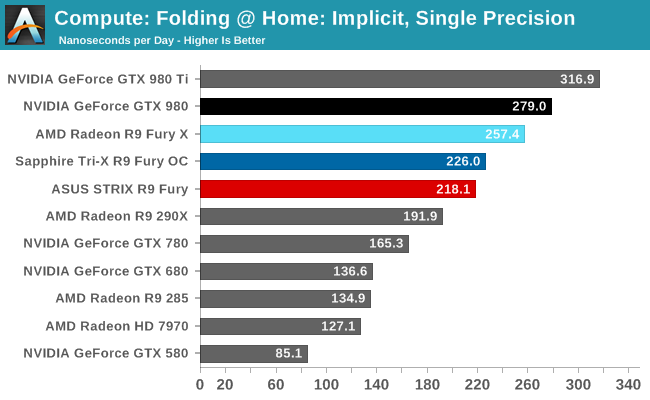
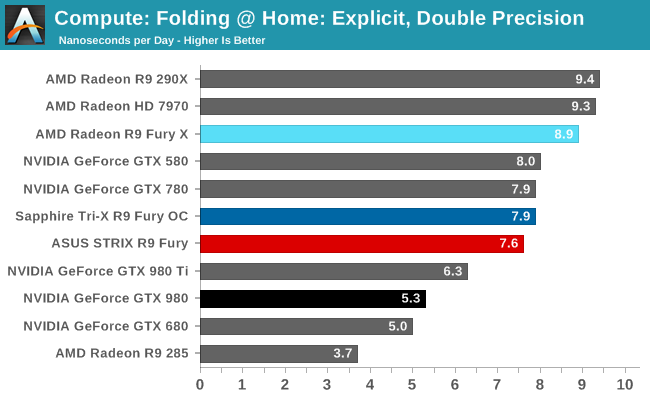
Overall while the R9 Fury doesn’t have to aim quite as high given its weaker GTX 980 competition, FAHBench still stresses the Radeon cards. Under single precision tests the GTX 980 pulls ahead, only surpassed under double precision thanks to NVIDIA’s weaker FP64 performance.
Wrapping things up, our final compute benchmark is an in-house project developed by our very own Dr. Ian Cutress. SystemCompute is our first C++ AMP benchmark, utilizing Microsoft’s simple C++ extensions to allow the easy use of GPU computing in C++ programs. SystemCompute in turn is a collection of benchmarks for several different fundamental compute algorithms, with the final score represented in points. DirectCompute is the compute backend for C++ AMP on Windows, so this forms our other DirectCompute test.
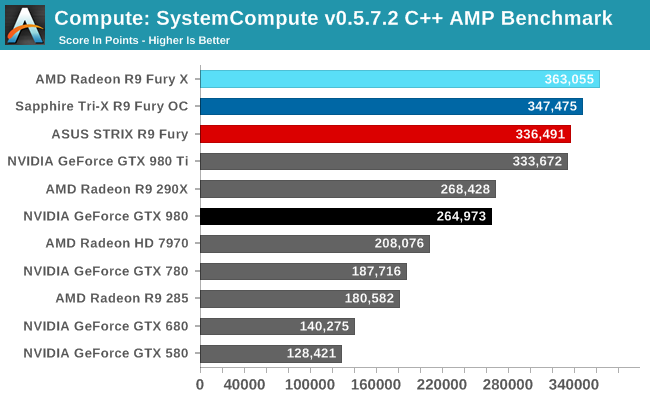
As with our other tests the R9 Fury loses some performance on our C++ AMP benchmark relative to the R9 Fury X, but only around 8%. As a result it’s competitive with the GTX 980 Ti here, blowing well past the GTX 980.


288 Comments
View All Comments
Oxford Guy - Saturday, July 11, 2015 - link
2% cost difference is likely to be erased by sale pricing at various times.darkfalz - Saturday, July 11, 2015 - link
My 980 is about 15% from stock, and it's a poor overclocker despite running cool. These cards struggle to hit 10%. I also can't go back 6 months ago and buy a R9 Fury. And Nvidia's next release is likely around the corner. I think they're approximately equal value - which is good for AMD fans, but it's been a long wait for them to have a card comparable to what NVIDIA enthusiasts have been enjoying for a year!Flunk - Friday, July 10, 2015 - link
It's nice to see AMD win a segment. I'm not sure that the Fury X matters that much in the grand scheme of things, seeing that it's the same price as the better performing Geforce 980 TI.The Fury seems to overclock to almost match the Fury X, making it a good enthusiast buy.
cmikeh2 - Friday, July 10, 2015 - link
If you're willing to over clock though, you can get a good 15+ percent out of the 980 and pretty much bring it even with an OCed Fury for a little less money.looncraz - Friday, July 10, 2015 - link
But as soon as voltage control is unlocked the fury will probably eek out at least another 100MHz or more, which will put it healthily out of reach of the 980. And, once a few more driver issues (such as GTA V performance) the performance of the Fury will improve even more.HBM has a different performance profile, and AMD is still accommodating that. And, of course, if you turn the nVidia image quality up to AMD levels, nVidia loses a few extra percent of performance.
The GTX 980 vs R9 Fury question is easy to answer (until a 980 price drop). The Fury X vs 980 Ti question is slightly more difficult (but the answer tends to go the other way, the AIO cooler being the Fury X's main draw).
D. Lister - Saturday, July 11, 2015 - link
"if you turn the nVidia image quality up to AMD levels, nVidia loses a few extra percent of performance."Surely we have some proof to go along with that allegation... ?
silverblue - Saturday, July 11, 2015 - link
I've heard the same thing, although I believe it was concerning the lack of anisotropic filtering on the NVIDIA side. However, anisotropic filtering is very cheap nowadays as far as I'm aware, so it's not really going to shake things up much whether it's on OR off, though image quality does improve noticeably.D. Lister - Saturday, July 11, 2015 - link
Err...http://international.download.nvidia.com/webassets...
You mean to say that it doesn't work like it is supposed to?
silverblue - Monday, July 13, 2015 - link
I'm not sure what you're getting at. In any case, I was trying to debunk the myth that turning off AF makes a real difference to performance.FlushedBubblyJock - Wednesday, July 15, 2015 - link
no, there's no proof, the proof of course is inside the raging gourd of the amd fanboy, never be unlocked by merely sane mortal beings.