The AMD Radeon R9 Fury X Review: Aiming For the Top
by Ryan Smith on July 2, 2015 11:15 AM ESTCompute
Shifting gears, we have our look at compute performance. As an FP64 card, the R9 Fury X only offers the bare minimum FP64 performance for a GCN product, so we won’t see anything great here. On the other hand with a theoretical FP32 performance of 8.6 TFLOPs, AMD could really clean house on our more regular FP32 workloads.
Starting us off for our look at compute is LuxMark3.0, the latest version of the official benchmark of LuxRender 2.0. LuxRender’s GPU-accelerated rendering mode is an OpenCL based ray tracer that forms a part of the larger LuxRender suite. Ray tracing has become a stronghold for GPUs in recent years as ray tracing maps well to GPU pipelines, allowing artists to render scenes much more quickly than with CPUs alone.
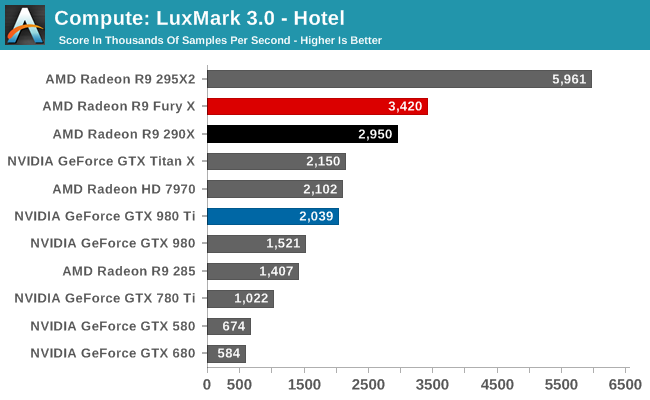
The results with LuxMark ended up being quite a bit of a surprise, and not for a good reason. Compute workloads are shader workloads, and these are workloads that should best illustrate the performance improvements of R9 Fury X over R9 290X. And yet while the R9 Fury X is the fastest single GPU AMD card, it’s only some 16% faster, a far cry from the 50%+ that it should be able to attain.
Right now I have no reason to doubt that the R9 Fury X is capable of utilizing all of its shaders. It just can’t do so very well with LuxMark. Given the fact that the R9 Fury X is first and foremost a gaming card, and OpenCL 1.x traction continues to be low, I am wondering whether we’re seeing a lack of OpenCL driver optimizations for Fiji.
For our second set of compute benchmarks we have CompuBench 1.5, the successor to CLBenchmark. CompuBench offers a wide array of different practical compute workloads, and we’ve decided to focus on face detection, optical flow modeling, and particle simulations.
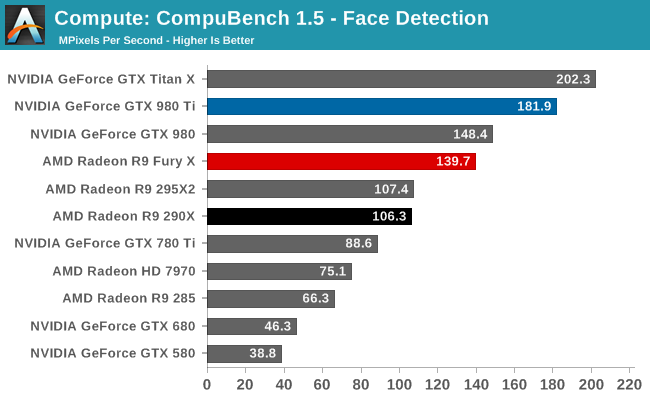
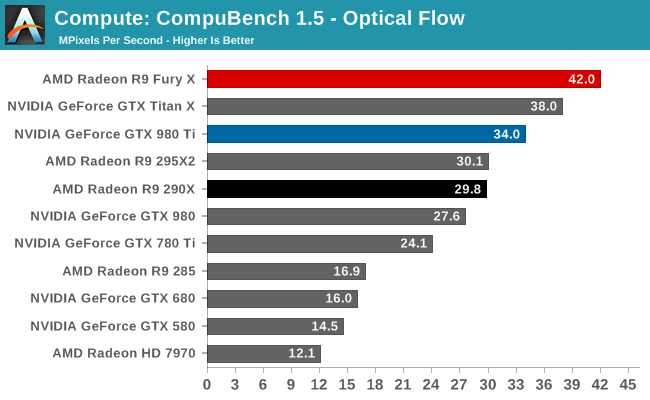
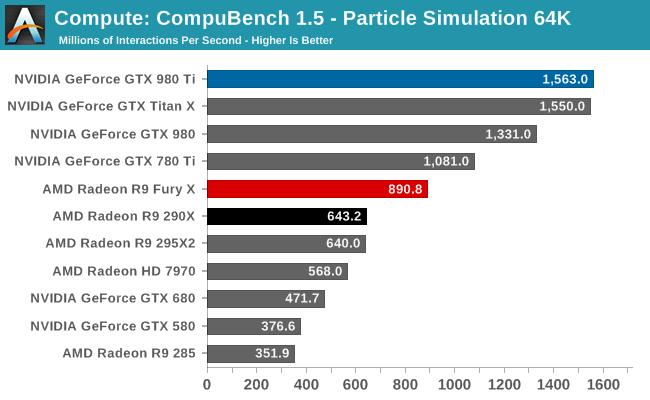
Quickly taking some of the air out of our driver theory, the R9 Fury X’s performance on CompuBench is quite a bit better, and much closer to what we’d expect given the hardware of the R9 Fury X. The Fury X only wins overall at Optical Flow, a somewhat memory-bandwidth heavy test that to no surprise favors AMD’s HBM additions, but otherwise the performance gains across all of these tests are 40-50%. Overall then the outcome over who wins is heavily test dependent, though this is nothing new.
Our 3rd compute benchmark is Sony Vegas Pro 13, an OpenGL and OpenCL video editing and authoring package. Vegas can use GPUs in a few different ways, the primary uses being to accelerate the video effects and compositing process itself, and in the video encoding step. With video encoding being increasingly offloaded to dedicated DSPs these days we’re focusing on the editing and compositing process, rendering to a low CPU overhead format (XDCAM EX). This specific test comes from Sony, and measures how long it takes to render a video.
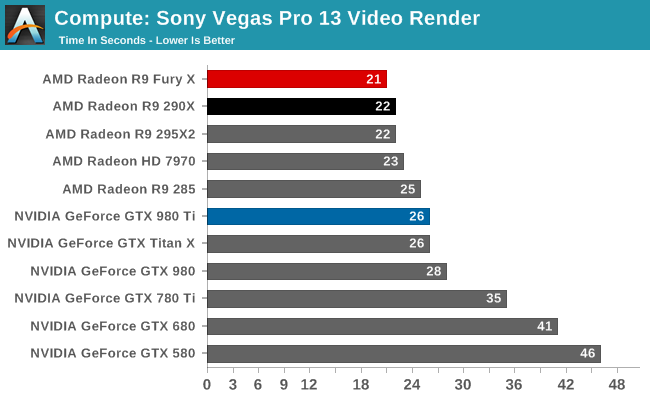
At this point Vegas is becoming increasingly CPU-bound and will be due for replacement. The Fury X none the less shaves off an additional second of rendering time, bringing it down to 21 seconds.
Moving on, our 4th compute benchmark is FAHBench, the official Folding @ Home benchmark. Folding @ Home is the popular Stanford-backed research and distributed computing initiative that has work distributed to millions of volunteer computers over the internet, each of which is responsible for a tiny slice of a protein folding simulation. FAHBench can test both single precision and double precision floating point performance, with single precision being the most useful metric for most consumer cards due to their low double precision performance. Each precision has two modes, explicit and implicit, the difference being whether water atoms are included in the simulation, which adds quite a bit of work and overhead. This is another OpenCL test, utilizing the OpenCL path for FAHCore 17.
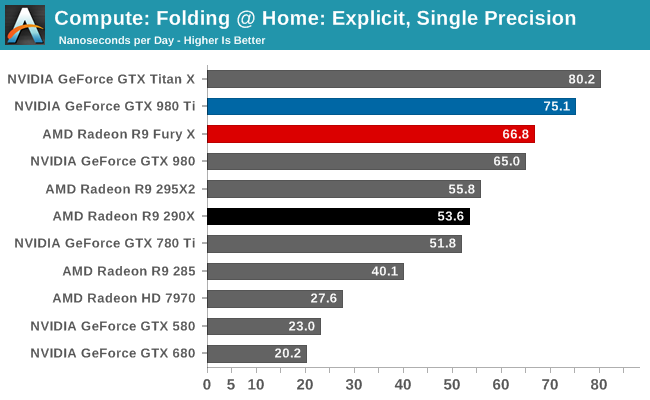
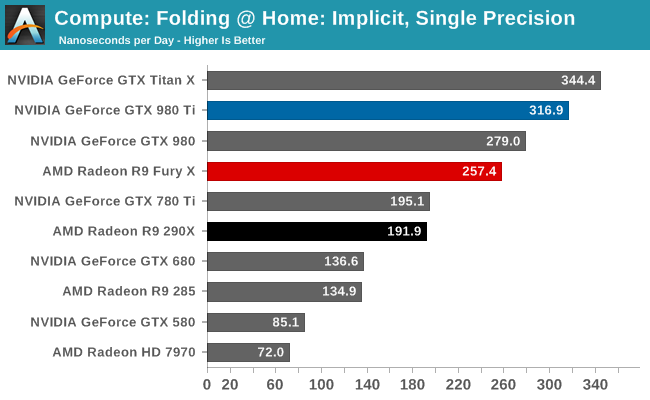
Both of the FP32 tests for FAHBench show smaller than expected performance gains given the fact that the R9 Fury X has such a significant increase in compute resources and memory bandwidth. 25% and 34% respectively are still decent gains, but they’re smaller gains than anything we saw on CompuBench. This does lend a bit more support to our theory about driver optimizations, though FAHBench has not always scaled well with compute resources to begin with.
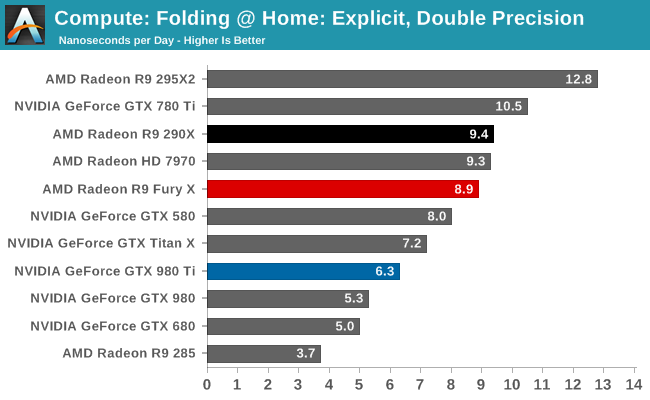
Meanwhile FP64 performance dives as expected. With a 1/16 rate it’s not nearly as bad as the GTX 900 series, but even the Radeon HD 7970 is beating the R9 Fury X here.
Wrapping things up, our final compute benchmark is an in-house project developed by our very own Dr. Ian Cutress. SystemCompute is our first C++ AMP benchmark, utilizing Microsoft’s simple C++ extensions to allow the easy use of GPU computing in C++ programs. SystemCompute in turn is a collection of benchmarks for several different fundamental compute algorithms, with the final score represented in points. DirectCompute is the compute backend for C++ AMP on Windows, so this forms our other DirectCompute test.
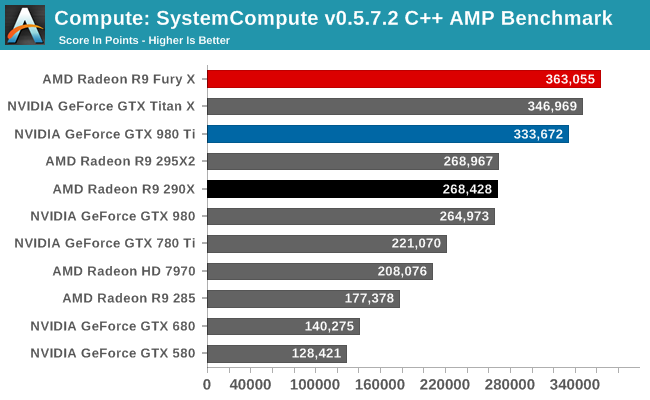
Our C++ AMP benchmark is another case of decent, though not amazing, GPU compute performance gains. The R9 Fury X picks up 35% over the R9 290X. And in fact this is enough to vault it over NVIDIA’s cards to retake the top spot here, though not by a great amount.


458 Comments
View All Comments
chizow - Friday, July 3, 2015 - link
While Intel wasn't the underdog in terms of marketshare, they were in terms of technology and performance with the Athlon 64 vs. Pentium 4. Intel had a dog on their hands that they managed to weather the storm with, until they got Conroe'd in 2006. Now, they are down and most likely out, as Zen even if it delivers as promised (40% IPC increase just isn't enough) will take years to gain traction in the CPU market. Time AMD simply does not have, especially given how far behind they've fallen in the dGPU market.nikaldro - Friday, July 3, 2015 - link
That's 40% over excavator, so about 60%? over vishera.If they manage to get good enough IPC on 8 cores, at a good price, they may really make a comeback
chizow - Monday, July 6, 2015 - link
Well, best of luck with this. :)bgo - Friday, July 3, 2015 - link
Well during the P4 era Intel bribed OEMs to not use Athlon chips, which they later had to pay $1.25bn to AMD for. While one could argue the monetary losses may have been partially made up for, the settlement came at the end of 2009, so too little too late. Intel bought themselves time with their bribes, and that's what really enabled them to weather the storms.chizow - Monday, July 6, 2015 - link
No, if you read the actual results and AMD's own testimony, they couldn't produce enough chips and offer them at a low enough price to OEMs compared to what Intel was just giving away as subsidies.piiman - Friday, July 3, 2015 - link
" AMD got beat by the underdog. "And that makes them the underdog now.
boozed - Thursday, July 2, 2015 - link
"Mantle is essentially depreciated at this point"Deprecated, surely?
chrisgon - Thursday, July 2, 2015 - link
"Which is not say I’m looking to paint a poor picture of the company – AMD Is nothing if not the perineal underdog who constantly manages to surprise us with what they can do with less"I think the word you were looking for is perennial. Unless you truly meant to refer to AMD as the taint.
ArKritz - Thursday, July 2, 2015 - link
I think there's about a 50-50 chance of that...ingwe - Thursday, July 2, 2015 - link
Thanks for the effort that went into this article. I hope you are feeling better.In general this article makes me continue to feel sad for AMD.