The AMD Radeon R9 Fury X Review: Aiming For the Top
by Ryan Smith on July 2, 2015 11:15 AM ESTCompute
Shifting gears, we have our look at compute performance. As an FP64 card, the R9 Fury X only offers the bare minimum FP64 performance for a GCN product, so we won’t see anything great here. On the other hand with a theoretical FP32 performance of 8.6 TFLOPs, AMD could really clean house on our more regular FP32 workloads.
Starting us off for our look at compute is LuxMark3.0, the latest version of the official benchmark of LuxRender 2.0. LuxRender’s GPU-accelerated rendering mode is an OpenCL based ray tracer that forms a part of the larger LuxRender suite. Ray tracing has become a stronghold for GPUs in recent years as ray tracing maps well to GPU pipelines, allowing artists to render scenes much more quickly than with CPUs alone.
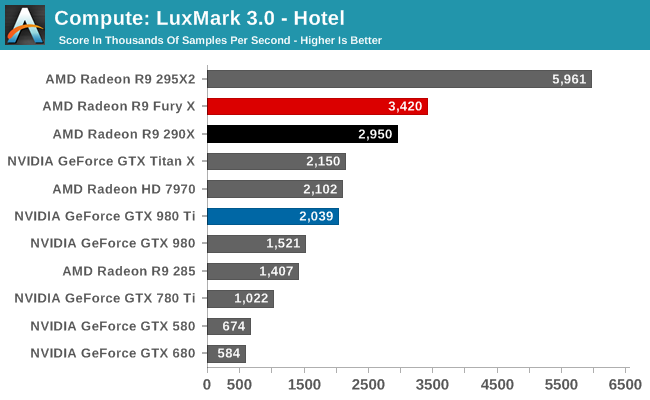
The results with LuxMark ended up being quite a bit of a surprise, and not for a good reason. Compute workloads are shader workloads, and these are workloads that should best illustrate the performance improvements of R9 Fury X over R9 290X. And yet while the R9 Fury X is the fastest single GPU AMD card, it’s only some 16% faster, a far cry from the 50%+ that it should be able to attain.
Right now I have no reason to doubt that the R9 Fury X is capable of utilizing all of its shaders. It just can’t do so very well with LuxMark. Given the fact that the R9 Fury X is first and foremost a gaming card, and OpenCL 1.x traction continues to be low, I am wondering whether we’re seeing a lack of OpenCL driver optimizations for Fiji.
For our second set of compute benchmarks we have CompuBench 1.5, the successor to CLBenchmark. CompuBench offers a wide array of different practical compute workloads, and we’ve decided to focus on face detection, optical flow modeling, and particle simulations.
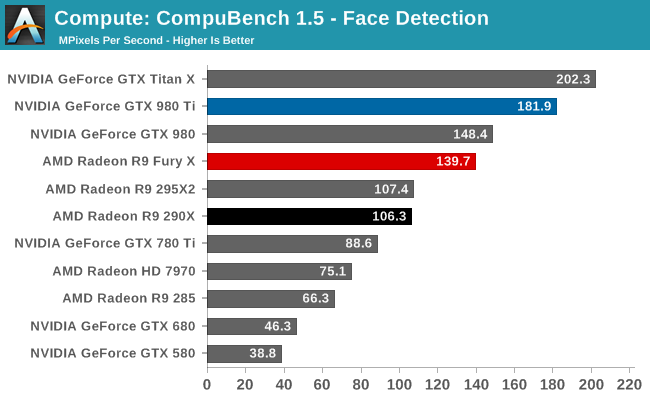
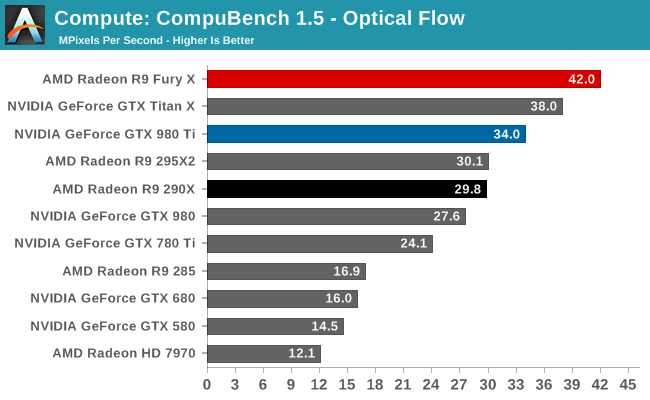
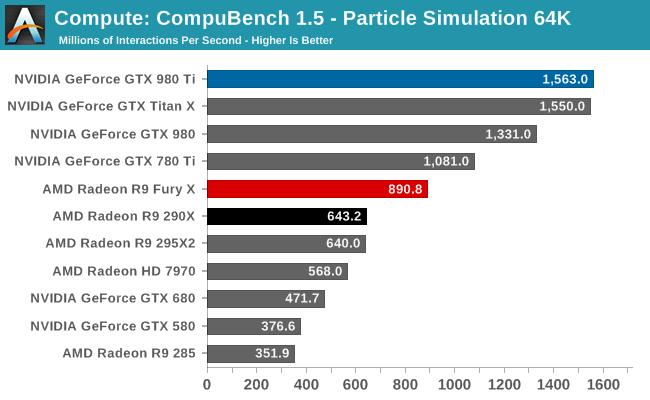
Quickly taking some of the air out of our driver theory, the R9 Fury X’s performance on CompuBench is quite a bit better, and much closer to what we’d expect given the hardware of the R9 Fury X. The Fury X only wins overall at Optical Flow, a somewhat memory-bandwidth heavy test that to no surprise favors AMD’s HBM additions, but otherwise the performance gains across all of these tests are 40-50%. Overall then the outcome over who wins is heavily test dependent, though this is nothing new.
Our 3rd compute benchmark is Sony Vegas Pro 13, an OpenGL and OpenCL video editing and authoring package. Vegas can use GPUs in a few different ways, the primary uses being to accelerate the video effects and compositing process itself, and in the video encoding step. With video encoding being increasingly offloaded to dedicated DSPs these days we’re focusing on the editing and compositing process, rendering to a low CPU overhead format (XDCAM EX). This specific test comes from Sony, and measures how long it takes to render a video.
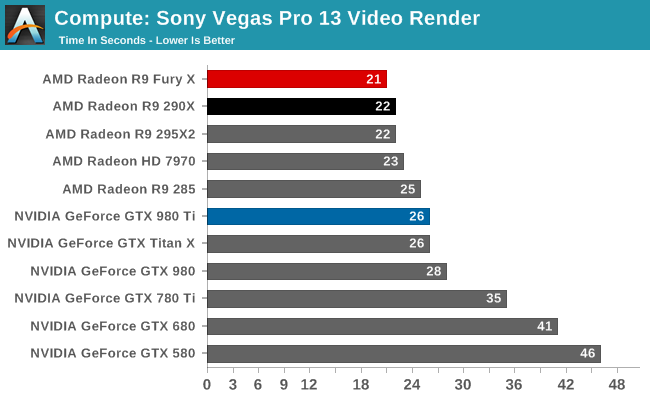
At this point Vegas is becoming increasingly CPU-bound and will be due for replacement. The Fury X none the less shaves off an additional second of rendering time, bringing it down to 21 seconds.
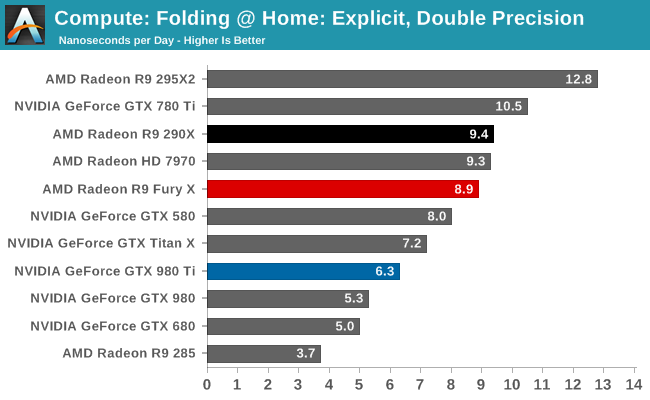
Moving on, our 4th compute benchmark is FAHBench, the official Folding @ Home benchmark. Folding @ Home is the popular Stanford-backed research and distributed computing initiative that has work distributed to millions of volunteer computers over the internet, each of which is responsible for a tiny slice of a protein folding simulation. FAHBench can test both single precision and double precision floating point performance, with single precision being the most useful metric for most consumer cards due to their low double precision performance. Each precision has two modes, explicit and implicit, the difference being whether water atoms are included in the simulation, which adds quite a bit of work and overhead. This is another OpenCL test, utilizing the OpenCL path for FAHCore 17.
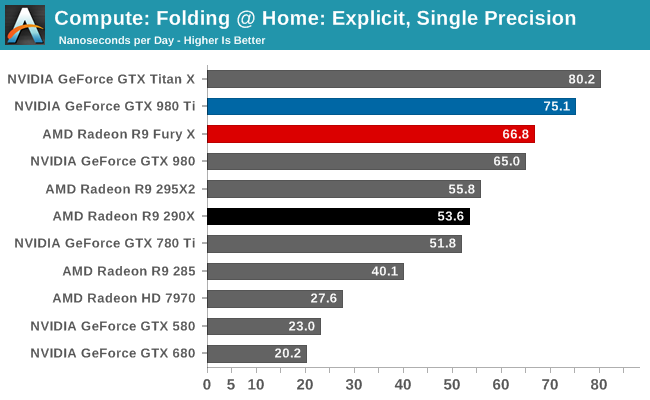
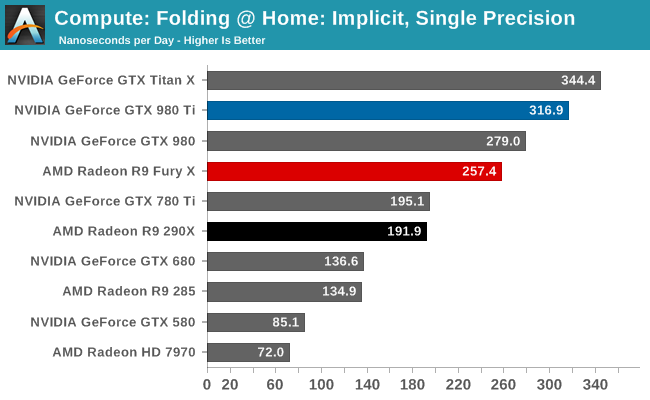
Both of the FP32 tests for FAHBench show smaller than expected performance gains given the fact that the R9 Fury X has such a significant increase in compute resources and memory bandwidth. 25% and 34% respectively are still decent gains, but they’re smaller gains than anything we saw on CompuBench. This does lend a bit more support to our theory about driver optimizations, though FAHBench has not always scaled well with compute resources to begin with.
Meanwhile FP64 performance dives as expected. With a 1/16 rate it’s not nearly as bad as the GTX 900 series, but even the Radeon HD 7970 is beating the R9 Fury X here.
Wrapping things up, our final compute benchmark is an in-house project developed by our very own Dr. Ian Cutress. SystemCompute is our first C++ AMP benchmark, utilizing Microsoft’s simple C++ extensions to allow the easy use of GPU computing in C++ programs. SystemCompute in turn is a collection of benchmarks for several different fundamental compute algorithms, with the final score represented in points. DirectCompute is the compute backend for C++ AMP on Windows, so this forms our other DirectCompute test.
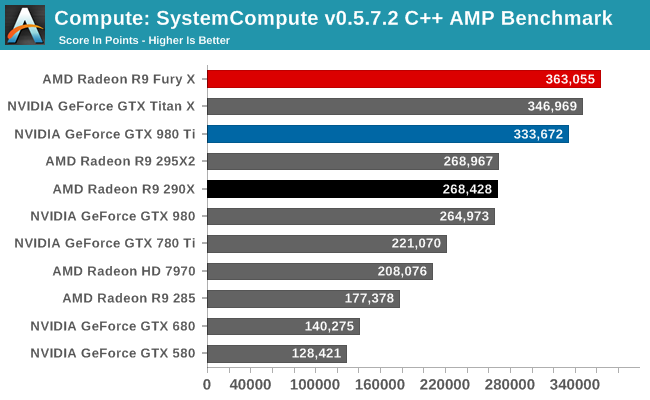
Our C++ AMP benchmark is another case of decent, though not amazing, GPU compute performance gains. The R9 Fury X picks up 35% over the R9 290X. And in fact this is enough to vault it over NVIDIA’s cards to retake the top spot here, though not by a great amount.


458 Comments
View All Comments
chizow - Thursday, July 2, 2015 - link
What about geometry Ryan? ROPs are often used interchangeably with Geometry/Set-up engine, there is definitely something going on with Fury X at lower resolutions, in instances where SP performance is no problem, it just can't draw/fill pixels fast enough and performs VERY similarly to previous gen or weaker cards (290X/390X and 980). TechReport actually has quite a few theoreticals that show this, where their pixel fill is way behind GM200 and much closer to Hawaii/GM204.extide - Thursday, July 2, 2015 - link
Yeah my bet is on Geometry. Check out the Synthetics page. It own the Pixel and Texel fillrate tests, but loses on the Tessellation test which has a large dependency on geometry. nVidia has also been historically very strong with geometry.CajunArson - Thursday, July 2, 2015 - link
Thanks for the review! While the conclusions aren't really any different than all the other reputable review sites on the Interwebs, you were very thorough and brought an interesting perspective to the table too. Better late than never!NikosD - Thursday, July 2, 2015 - link
You must use the latest nightly build of LAV filters, in order to be able to use the 4K H.264 DXVA decoder of AMD cards.All previous builds fall back to SW mode.
tynopik - Thursday, July 2, 2015 - link
"today’s launch of the Fiji GPU"andychow - Thursday, July 2, 2015 - link
Best review ever. Worth the wait. Get sick more often!tynopik - Thursday, July 2, 2015 - link
pg 2 - compression taking palcelimitedaccess - Thursday, July 2, 2015 - link
Ryan, regarding Mantle performance back in the R9 285 review (http://www.anandtech.com/show/8460/amd-radeon-r9-2... you wrote that AMD stated the issue with performance regression was that developers had not yet optimized for Tonga's newer architecture. While here you state that the performance regression is due to AMD having not optimized on the driver side. What is the actual case? What is the actual weighting given these three categories? -Hardware Driver
API
Software/Game
What I'm wondering is if we make an assumption that upcoming low level APIs will have similar behavior as Mantle what will happen going forward as more GPU architectures are introduced and newer games are introduced? If the onus shifts especially heavily towards the software side it it seems more realistic in practice that developers will have much more narrower scope in which optimize for.
I'm wondering if Anandtech could possibly look more indept into this issue as to how it pertains to the move towards low level APIs used in the future as it could have large implications in terms of the software/hardware support relationship going forward.
Ryan Smith - Thursday, July 2, 2015 - link
"What is the actual case? What is the actual weighting given these three categories? -"Right now the ball appears to be solidly in AMD's court. They are taking responsibility for the poor performance of certain Mantle titles on R9 Fury X.
As it stands I hesitate to read into this too much for DX12/Vulkan. Those are going to be finalized, widely supported APIs, unlike Mantle which has gone from production to retirement in the span of just over a year.
limitedaccess - Thursday, July 2, 2015 - link
Thanks for the response. I guess we will see more for certain as time moves on.My concern is if lower level APIs require more architecture specific optimizations and the burden is shifted to developers in practice that will cause some rather "interesting" implications.
Also what would be of interest is how much of reviewers test suites will still look at DX11 performance as a possible fallback should this become a possible issue.