The Intel Broadwell Desktop Review: Core i7-5775C and Core i5-5675C Tested (Part 1)
by Ian Cutress on June 2, 2015 7:45 AM ESTGaming Benchmarks: High End
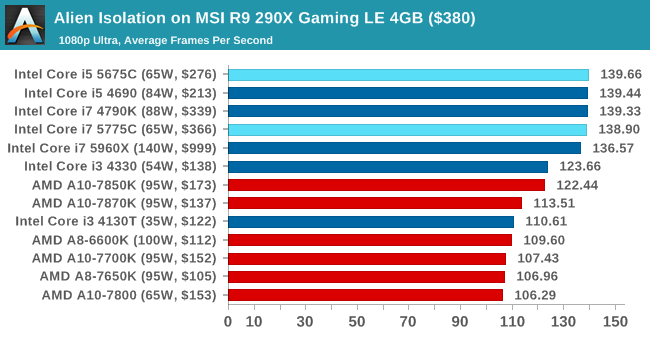
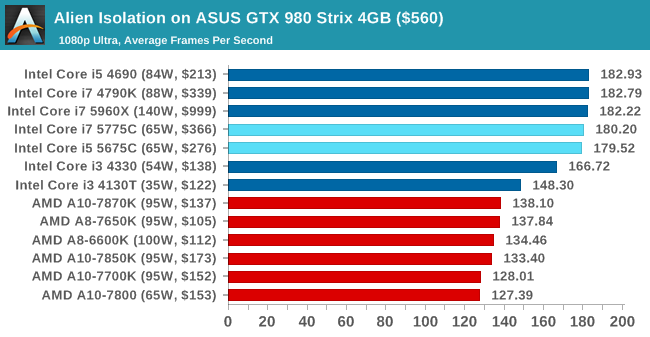
Last but certainly not least, we have our gaming benchmarks with our high-end Radeon R9 290X and GeForce GTX 980 video cards. Depending on the settings used, we can end up outright CPU limited here if the dGPUs don't become the bottleneck first.
Alien: Isolation
If first person survival mixed with horror is your sort of thing, then Alien: Isolation, based off of the Alien franchise, should be an interesting title. Developed by The Creative Assembly and released in October 2014, Alien: Isolation has won numerous awards from Game Of The Year to several top 10s/25s and Best Horror titles, ratcheting up over a million sales by February 2015. Alien: Isolation uses a custom built engine which includes dynamic sound effects and should be fully multi-core enabled.
For low end graphics, we test at 720p with Ultra settings, whereas for mid and high range graphics we bump this up to 1080p, taking the average frame rate as our marker with a scripted version of the built-in benchmark.

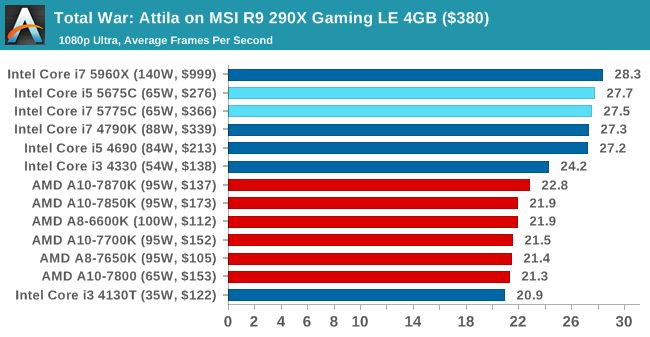
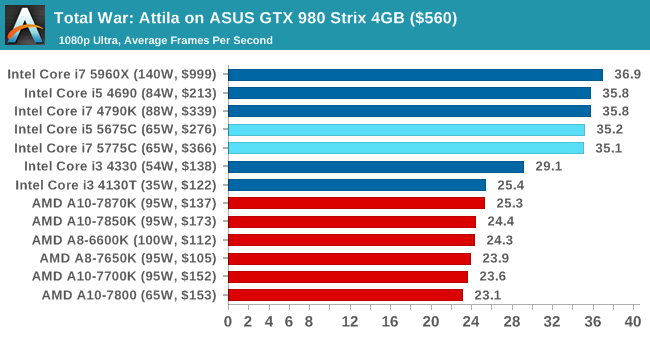
Total War: Attila
The Total War franchise moves on to Attila, another The Creative Assembly development, and is a stand-alone strategy title set in 395AD where the main story line lets the gamer take control of the leader of the Huns in order to conquer parts of the world. Graphically the game can render hundreds/thousands of units on screen at once, all with their individual actions and can put some of the big cards to task.
For low end graphics, we test at 720p with performance settings, recording the average frame rate. With mid and high range graphics, we test at 1080p with the quality setting. In both circumstances, unlimited video memory is enabled and the in-game scripted benchmark is used.

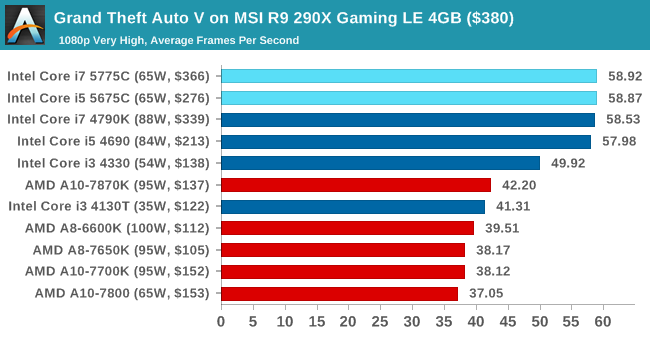
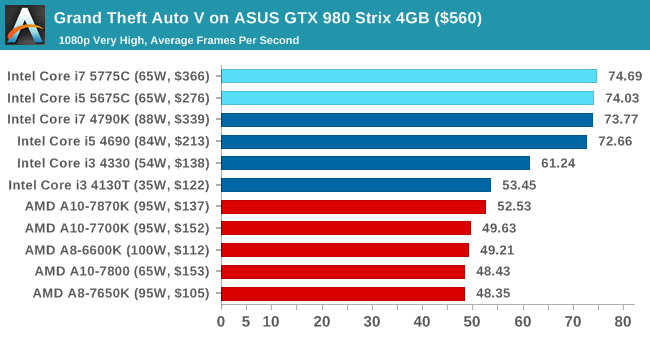
Grand Theft Auto V
The highly anticipated iteration of the Grand Theft Auto franchise finally hit the shelves on April 14th 2015, with both AMD and NVIDIA in tow to help optimize the title. GTA doesn’t provide graphical presets, but opens up the options to users and extends the boundaries by pushing even the hardest systems to the limit using Rockstar’s Advanced Game Engine. Whether the user is flying high in the mountains with long draw distances or dealing with assorted trash in the city, when cranked up to maximum it creates stunning visuals but hard work for both the CPU and the GPU.
For our test we have scripted a version of the in-game benchmark, relying only on the final part which combines a flight scene along with an in-city drive-by followed by a tanker explosion. For low end systems we test at 720p on the lowest settings, whereas mid and high end graphics play at 1080p with very high settings across the board. We record both the average frame rate and the percentage of frames under 60 FPS (16.6ms).

![Grand Theft Auto V on MSI R9 290X Gaming LE 4GB ($380) [Under 60 FPS]](https://images.anandtech.com/graphs/graph9320/74977.png)
![Grand Theft Auto V on ASUS GTX 980 Strix 4GB ($560) [Under 60 FPS]](https://images.anandtech.com/graphs/graph9320/74989.png)
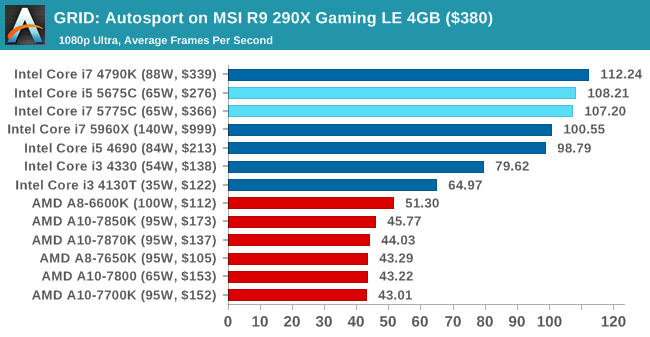
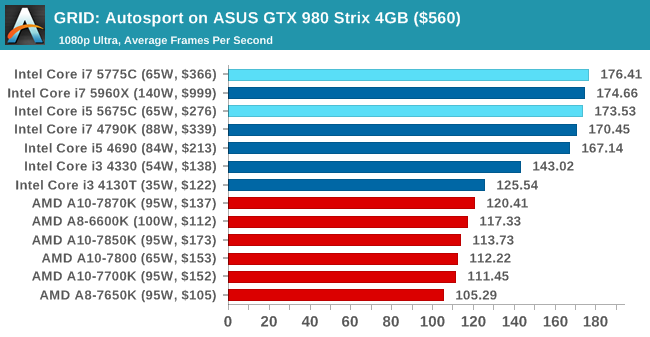
GRID: Autosport
No graphics tests are complete without some input from Codemasters and the EGO engine, which means for this round of testing we point towards GRID: Autosport, the next iteration in the GRID and racing genre. As with our previous racing testing, each update to the engine aims to add in effects, reflections, detail and realism, with Codemasters making ‘authenticity’ a main focal point for this version.
GRID’s benchmark mode is very flexible, and as a result we created a test race using a shortened version of the Red Bull Ring with twelve cars doing two laps. The car is focus starts last and is quite fast, but usually finishes second or third. For low end graphics we test at 1080p medium settings, whereas mid and high end graphics get the full 1080p maximum. Both the average and minimum frame rates are recorded.

![GRID: Autosport on MSI R9 290X Gaming LE 4GB ($380) [Minimum FPS]](https://images.anandtech.com/graphs/graph9320/74979.png)
![GRID: Autosport on ASUS GTX 980 Strix 4GB ($560) [Minimum FPS]](https://images.anandtech.com/graphs/graph9320/74991.png)
Middle-Earth: Shadows of Mordor
The final title in our testing is another battle of system performance with the open world action-adventure title, Shadows of Mordor. Produced by Monolith using the LithTech Jupiter EX engine and numerous detail add-ons, SoM goes for detail and complexity to a large extent, despite having to be cut down from the original plans. The main story itself was written by the same writer as Red Dead Redemption, and it received Zero Punctuation’s Game of The Year in 2014.
For testing purposes, SoM gives a dynamic screen resolution setting, allowing us to render at high resolutions that are then scaled down to the monitor. As a result, we get several tests using the in-game benchmark. For low end graphics we examine at 720p with low settings, whereas mid and high end graphics get 1080p Ultra. The top graphics test is also redone at 3840x2160, also with Ultra settings, and we also test two cards at 4K where possible.

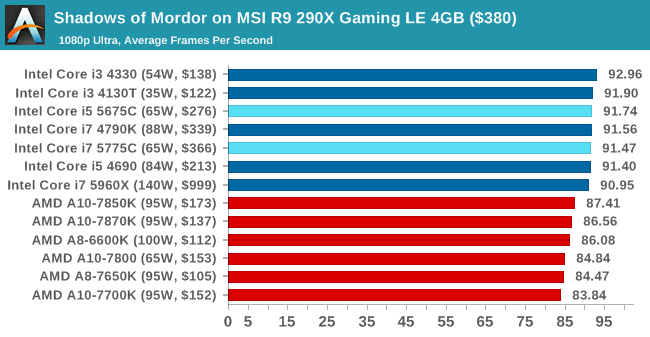
![Shadows of Mordor on MSI R9 290X Gaming LE 4GB ($380) [Minimum FPS]](https://images.anandtech.com/graphs/graph9320/74981.png)
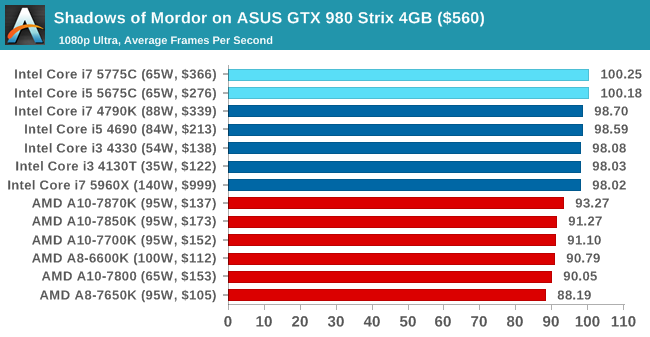
![Shadows of Mordor on ASUS GTX 980 Strix 4GB ($560) [Minimum FPS]](https://images.anandtech.com/graphs/graph9320/74993.png)
Shadows of Mordor at 4K, Single GPU
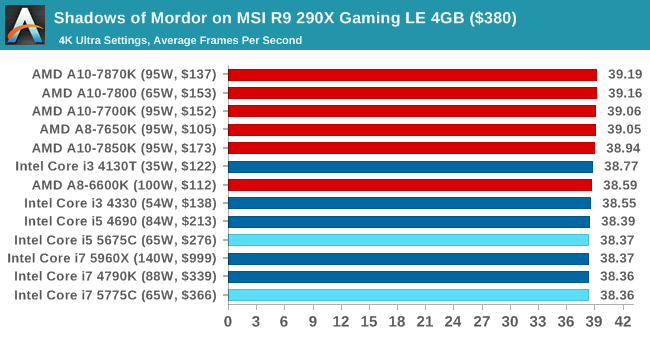
![Shadows of Mordor on MSI R9 290X Gaming LE 4GB ($380) [Minimum FPS]](https://images.anandtech.com/graphs/graph9320/74983.png)

![Shadows of Mordor on ASUS GTX 980 Strix 4GB ($560) [Minimum FPS]](https://images.anandtech.com/graphs/graph9320/74995.png)
Shadows of Mordor at 4K, Dual GPU (Crossfire/SLI)
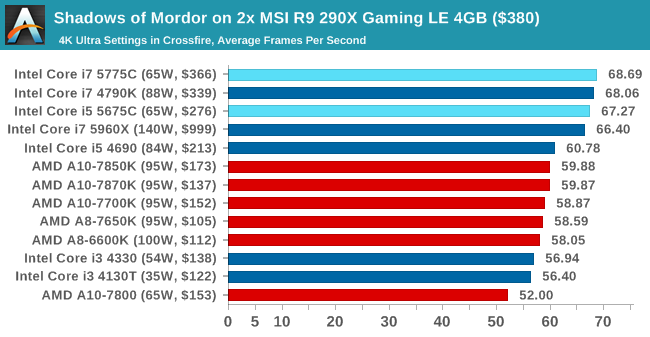
![Shadows of Mordor on 2x MSI R9 290X Gaming LE 4GB ($380) [Minimum FPS]](https://images.anandtech.com/graphs/graph9320/74985.png)
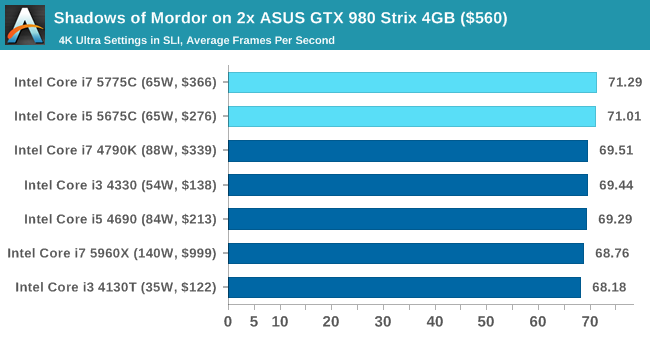
![Shadows of Mordor on 2x ASUS GTX 980 Strix 4GB ($560) [Minimum FPS]](https://images.anandtech.com/graphs/graph9320/74997.png)
Conclusions on High-End Graphics
Once again we aren't seeing levels of performance that Haswell wasn't already hitting, however at the same time the Broadwell SKUs are doing quite well given their lower frequencies and TDPs. Which is going to make overclocking all the more interesting, to see what these chips can reach, and if they can reach past the i7-4770K.


196 Comments
View All Comments
Pcorb - Tuesday, June 2, 2015 - link
I'm not so sure that high end desktop users are a large enough demographic that Intel will be complaining any time soon.yannigr2 - Wednesday, June 3, 2015 - link
Yes I am shouting that for a month now, but of course I was treated as an AMD brainless fanboy when pointing at that, so I must be wrong. Now we have a chart that it is misleading and hilarious at the same time. If Ian had done what is right and logical, those charts would have been informative, correct and fair. I think AMD created 7870K just to troll Ian's charts.Hulk - Tuesday, June 2, 2015 - link
It would be really nice if you would note the frequency each processor is running during each test. With all the turbos these days it's hard to know and therefore hard to make IPC comparisons.Mr Perfect - Tuesday, June 2, 2015 - link
Yes, please. Once upon a time, I would have had the clocks for all the models memorized, but without that comparing IPC is difficult to impossible without the clocks noted.MrSpadge - Tuesday, June 2, 2015 - link
+1Lonyo - Tuesday, June 2, 2015 - link
You state in the opening that if you upgrade on a 3 year cycle, you would be coming from SandyBridge. Would it not make sense to have some older Intel processors in the graphs?Ian Cutress - Tuesday, June 2, 2015 - link
With a recent new testing suite, we haven't gone back through enough generations yet with the new benchmarking scheme. You can still check legacy benchmarks (Cinebench 10 / POV-Ray) between old and new in Bench. www.anandtech.com/benchHulk - Tuesday, June 2, 2015 - link
Yes. One thing Anand did amazingly well was review the new Intel processors. Clock-normalized IPC comparisons from previous generations is really what we want to see. As well as normalized power consumption, ie energy used completing the same workload.mgilbert - Tuesday, June 2, 2015 - link
As a normal home PC user/gamer, I couldn't care less about small differences in power consumption. Sure, 100 Watts might matter, but what matters most to me is outright performance.Martin84a - Tuesday, June 2, 2015 - link
As a normal PC user/gamer, that's all I care about. Less heat and thus less noise. Having a passively cooled PC that never goes above 65C under load is pure bliss.