Intel NUC5i7RYH Broadwell-U Iris NUC Review
by Ganesh T S on April 20, 2015 8:00 AM EST- Posted in
- Systems
- Intel
- HTPC
- NUC
- Broadwell-U
Networking and Storage Performance
We have recently started devoting a separate section to analyze the storage and networking credentials of the units under review. On the storage side, one option would be repetition of our strenuous SSD review tests on the drive(s) in the PC. Fortunately, to avoid that overkill, PCMark 8 has a storage bench where certain common workloads such as loading games and document processing are replayed on the target drive. Results are presented in two forms, one being a benchmark number and the other, a bandwidth figure. We ran the PCMark 8 storage bench on selected PCs and the results are presented below.
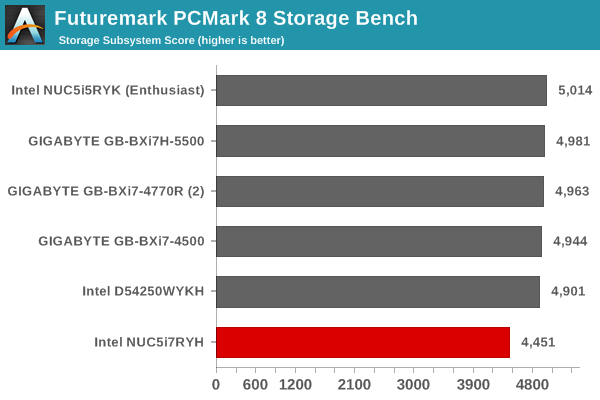
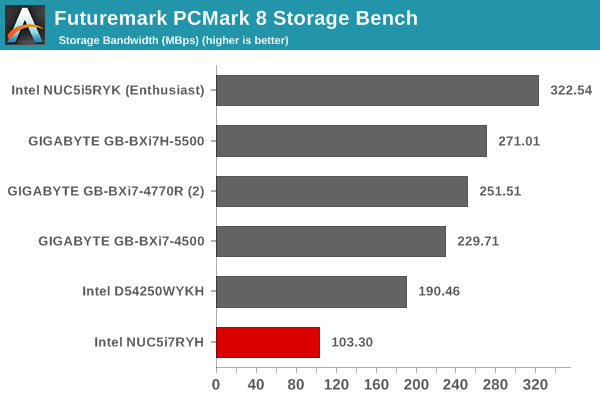
The MZVPV256 is the first NVMe SSD in the M.2 form factor. Given its PCIe 2.0 x4 link (the controller supports PCIe 3.0, but the unit connects to the PCIe 2.0 lanes in the Broadwell-U package) and the advantages of NVMe over AHCI, we expected our configuration to lead the storage charts. Our unexpected results made us run a couple of other artificial benchmarks (reproduced below).
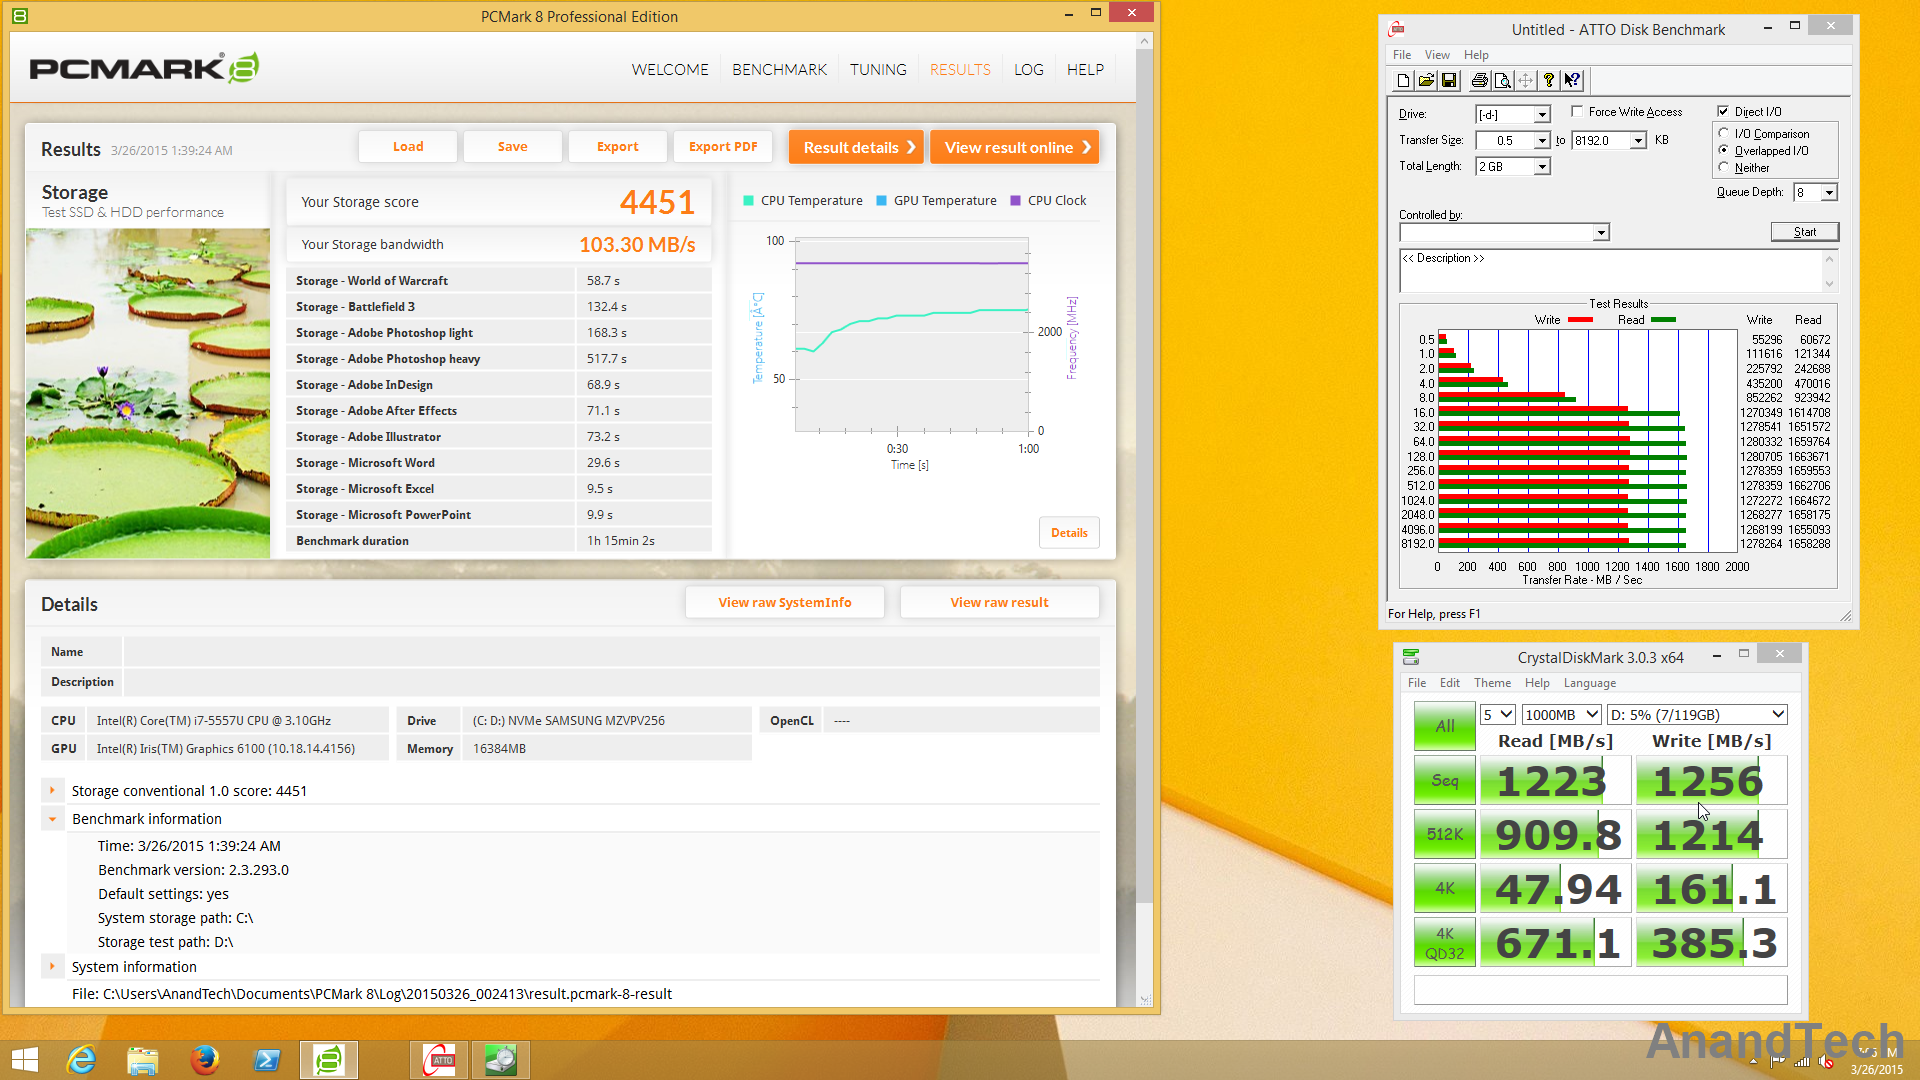
The results from ATTO and CrystalDiskMark matches the specifications (accounting for the downgrade of the host link from PCIe 3.0 to PCIe 2.0). After discussion with Samsung, it turned out that the performance difference was due to the Microsoft NVMe driver creating FUA (Force Unit Access) I/O write commands. These FUA commands bypass the DRAM cache on the SSD and directly write to the flash, increasing the response time and also lowering bandwidth. For the same access traces, this situation does not happen with the Microsoft AHCI driver.
We observed something similar with the Intel SSD P3700 NVMe PCIe drive. With the Microsoft NVMe driver, the benchmark reported storage bandwidth around 320 MBps, while the Intel NVMe driver bumped that upwards of 500 MBps. So, we can conclude with a high degree of confidence that the Microsoft NVMe driver needs some fixes.
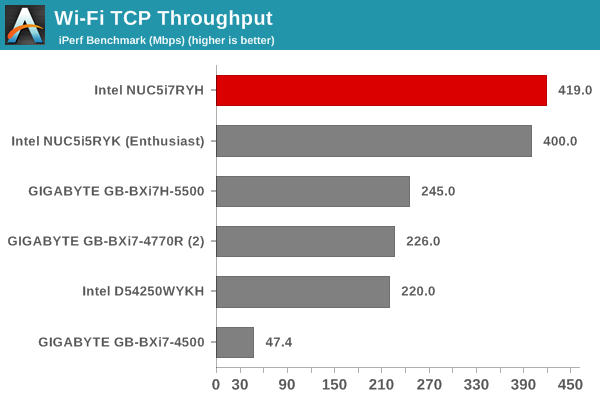
On the networking side, we restricted ourselves to the evaluation of the WLAN component. Our standard test router is the Netgear R7000 Nighthawk configured with both 2.4 GHz and 5 GHz networks. The router is placed approximately 20 ft. away, separated by a drywall (as in a typical US building). A wired client (Zotac ID89-Plus) is connected to the R7000 and serves as one endpoint for iPerf evaluation. The PC under test is made to connect to either the 5 GHz (preferred) or 2.4 GHz SSID and iPerf tests are conducted for both TCP and UDP transfers. It is ensured that the PC under test is the only wireless client for the Netgear R7000. We evaluate total throughput for up to 32 simultaneous TCP connections using iPerf and present the highest number in the graph below.
In the UDP case, we try to transfer data at the highest rate possible for which we get less than 1% packet loss.
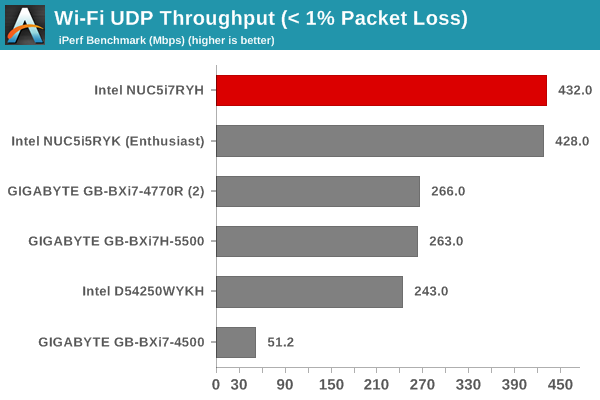
Recent driver updates have enabled the Intel AC726x solutions to perform up to their advertised potential. Users facing issues with them are urged to update their drivers as well as router firmware in order to take advantage of the capabilities. The Broadwell-U NUC (NUC5i5RYK) uses the same Intel AC-7265 2x2 802.11ac soldered M.2 Wi-Fi card as the NUC5i7RYH. So, it is not surprising that the TCP and UDP throughputs are similar for the two systems.


66 Comments
View All Comments
ganeshts - Monday, April 20, 2015 - link
I can understand the issue for people who are following each and every review that is published here. On the other hand, many of our readers come from search results - say, someone searching on Google for 'Iris NUC review' - So, it is necessary for each review to be a 'standalone' piece ; I have published 10+ UCFF PC reviews in the last year or so. I would rather spend time writing about the actual benchmark results rather than thinking about 10 different ways to convey the same information.If you are a regular reader, the only item of interest in the introductory section would be the table listing the specs of the unit on a comparative basis. Feel free to skim over the introductory section and dive into the actual benchmark results if you are a regular reader.
keg504 - Monday, April 20, 2015 - link
The title for the DiRT Showdown benchmarks is "Tomb Raider" for some reason...ganeshts - Monday, April 20, 2015 - link
Thanks! Fixed ithlovatt - Monday, April 20, 2015 - link
@ganeshts Any chance of a Mac Mini review to see how it stacks up in the HTPC stakes? After all the Mac Mini is one of the founders of this form factor.milkod2001 - Monday, April 20, 2015 - link
i'll second that, please do review and comparison NUC vs Mac Mini if possible.zodiacfml - Monday, April 20, 2015 - link
After all the Core M review these days, 28 watts appeared a performance monster at first glance.Yet, this is no Quad Core compared to previous similarly priced NUC. Not impressed.
meacupla - Monday, April 20, 2015 - link
If you're talking about that Brix Pro, that thing was a beast and it consumes about 2x the power that this NUC does.zodiacfml - Tuesday, April 21, 2015 - link
True, but these devices are plugged in. For a notebook, I might reconsider.Pork@III - Monday, April 20, 2015 - link
Weak is weak, if you will, and it names NUClear.meacupla - Monday, April 20, 2015 - link
If it said "NUClear" on the package, I would totally expect it to contain an R9 290X and subsequently melt down to a smouldering pile of plastic, silicon and PCB the moment it is subjected to ground breaking benchmarks.