The Samsung SSD 850 EVO mSATA/M.2 Review
by Kristian Vättö on March 31, 2015 10:00 AM ESTAnandTech Storage Bench - The Destroyer
The Destroyer has been an essential part of our SSD test suite for nearly two years now. It was crafted to provide a benchmark for very IO intensive workloads, which is where you most often notice the difference between drives. It's not necessarily the most relevant test to an average user, but for anyone with a heavier IO workload The Destroyer should do a good job at characterizing performance.
| AnandTech Storage Bench - The Destroyer | ||||||||||||
| Workload | Description | Applications Used | ||||||||||
| Photo Sync/Editing | Import images, edit, export | Adobe Photoshop CS6, Adobe Lightroom 4, Dropbox | ||||||||||
| Gaming | Download/install games, play games | Steam, Deus Ex, Skyrim, Starcraft 2, BioShock Infinite | ||||||||||
| Virtualization | Run/manage VM, use general apps inside VM | VirtualBox | ||||||||||
| General Productivity | Browse the web, manage local email, copy files, encrypt/decrypt files, backup system, download content, virus/malware scan | Chrome, IE10, Outlook, Windows 8, AxCrypt, uTorrent, AdAware | ||||||||||
| Video Playback | Copy and watch movies | Windows 8 | ||||||||||
| Application Development | Compile projects, check out code, download code samples | Visual Studio 2012 | ||||||||||
The table above describes the workloads of The Destroyer in a bit more detail. Most of the workloads are run independently in the trace, but obviously there are various operations (such as backups) in the background.
| AnandTech Storage Bench - The Destroyer - Specs | ||||||||||||
| Reads | 38.83 million | |||||||||||
| Writes | 10.98 million | |||||||||||
| Total IO Operations | 49.8 million | |||||||||||
| Total GB Read | 1583.02 GB | |||||||||||
| Total GB Written | 875.62 GB | |||||||||||
| Average Queue Depth | ~5.5 | |||||||||||
| Focus | Worst case multitasking, IO consistency | |||||||||||
The name Destroyer comes from the sheer fact that the trace contains nearly 50 million IO operations. That's enough IO operations to effectively put the drive into steady-state and give an idea of the performance in worst case multitasking scenarios. About 67% of the IOs are sequential in nature with the rest ranging from pseudo-random to fully random.
| AnandTech Storage Bench - The Destroyer - IO Breakdown | |||||||||||
| IO Size | <4KB | 4KB | 8KB | 16KB | 32KB | 64KB | 128KB | ||||
| % of Total | 6.0% | 26.2% | 3.1% | 2.4% | 1.7% | 38.4% | 18.0% | ||||
I've included a breakdown of the IOs in the table above, which accounts for 95.8% of total IOs in the trace. The leftover IO sizes are relatively rare in between sizes that don't have a significant (>1%) share on their own. Over a half of the transfers are large IOs with one fourth being 4KB in size.
| AnandTech Storage Bench - The Destroyer - QD Breakdown | ||||||||||||
| Queue Depth | 1 | 2 | 3 | 4-5 | 6-10 | 11-20 | 21-32 | >32 | ||||
| % of Total | 50.0% | 21.9% | 4.1% | 5.7% | 8.8% | 6.0% | 2.1% | 1.4 | ||||
Despite the average queue depth of 5.5, a half of the IOs happen at queue depth of one and scenarios where the queue depths is higher than 10 are rather infrequent.
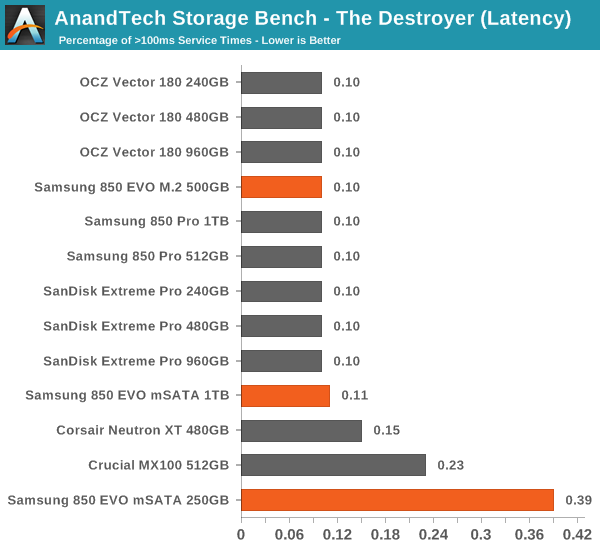
The two key metrics I'm reporting haven't changed and I'll continue to report both data rate and latency because the two have slightly different focuses. Data rate measures the speed of the data transfer, so it emphasizes large IOs that simply account for a much larger share when looking at the total amount of data. Latency, on the other hand, ignores the IO size, so all IOs are given the same weight in the calculation. Both metrics are useful, although in terms of system responsiveness I think the latency is more critical. As a result, I'm also reporting two new stats that provide us a very good insight to high latency IOs by reporting the share of >10ms and >100ms IOs as a percentage of the total.
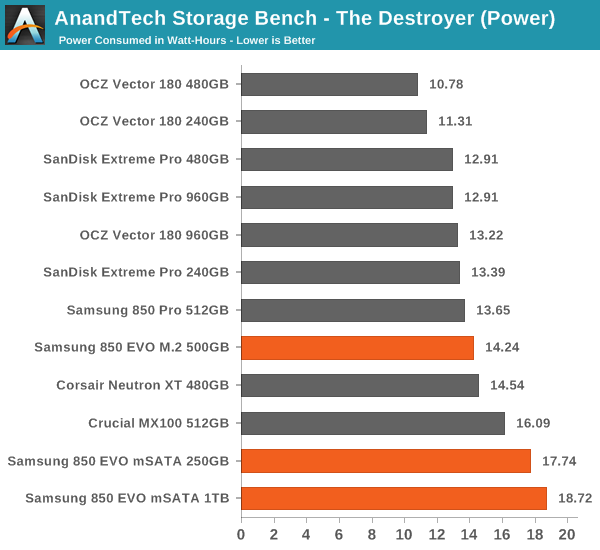
I'm also reporting the total power consumed during the trace, which gives us good insight into the drive's power consumption under different workloads. It's better than average power consumption in the sense that it also takes performance into account because a faster completion time will result in less watt-hours consumed. Since the idle times of the trace have been truncated for faster playback, the number doesn't fully address the impact of idle power consumption, but nevertheless the metric is valuable when it comes active power consumption.

The pausing issue of the 1TB 850 EVO mSATA also translates straight to our The Destroyer trace. While higher capacities are usually faster than smaller capacities in this test, the 1TB mSATA is about 15% slower than the 500GB M.2. Generally speaking the 850 EVO does very well at 500GB and above, but since Samsung's TLC V-NAND is 128Gbit in capacity and single-plane, the 250GB can't keep up with drives that are using smaller capacity NAND for higher parallelism.
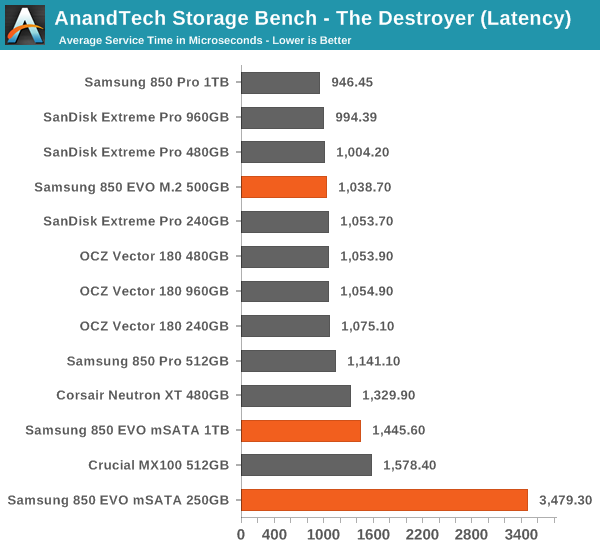
The latency graph further illustrates the poor performance of the 1TB mSATA, but quite surprisingly the 500GB 850 EVO is actually faster than the 512GB 850 Pro. I suspect the additional over-provisioning helps because The Destroyer is a very intensive trace that practically puts the drive into steady-state .
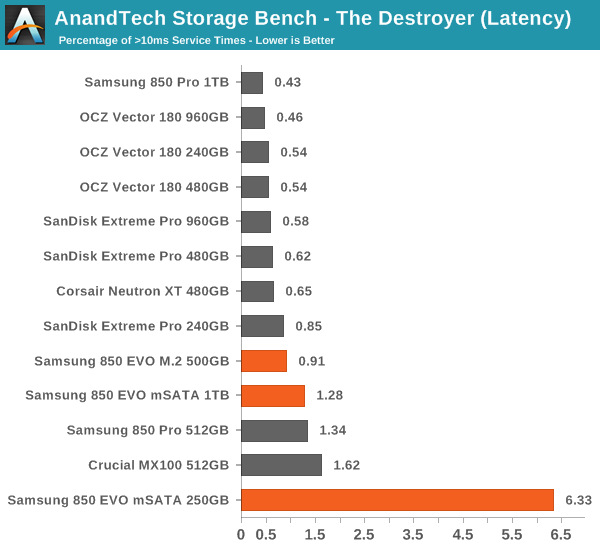
The share of high latency IOs is a bit high, but nothing to be concerned of. Only the 250GB model has a significant amount of >10ms IOs and for IO intensive workloads I would strongly advise to go with 500GB or higher.
Active power consumption seems to be quite high for the 850 EVO, although I'm not surprised since TLC generally consumes more power than MLC due to its inherent design (more program pulses needed to achieve the final voltage state).


58 Comments
View All Comments
Laststop311 - Wednesday, April 1, 2015 - link
Was really disappointed with the 1TB results. Also disappointed no ultra m2 interface. I wont be upgrading until I can get a pci-e 3.0 x4 interface on the drive. The samsung sm951 is where its at.Laststop311 - Wednesday, April 1, 2015 - link
Really annoying that I dont see this drive for sale anywhere and it's been talked about for a loooong timeKristian Vättö - Wednesday, April 1, 2015 - link
RamCity just got its first SM951 batch, so it's now available for purchase.https://www.ramcity.com.au/upgrade/data-storage/in...
bricko - Thursday, April 2, 2015 - link
Is the 951 NVMe - How to they compare to the new Intel 750 series which are PCIe gen 3 and NVMeseen here
http://linustechtips.com/main/topic/340041-intel-l...
http://forums.overclockers.co.uk/showthread.php?p=...
Intel are launching the new 750 Series range of SSD's these are PCI-E 3.0 versions with 4 lanes and are NVMe based SSD's
goodyes - Wednesday, April 1, 2015 - link
Ya, but results that I have a 1TB 840 msata and write sequential at more than 500MBps around 520max MBps, and now I see than new 850 msata tops at ?? 480MBps ?? cannot be possible what my eyes look, AND WHY THE HELL NO ONE REVIEWER COMPARE With olders 840 msata, so I must think that all of you guys are a paid reviewers and you get money from samsung, if not, YOU MUST compare to older modelKenPC - Wednesday, April 1, 2015 - link
I am seriously concerned that the 840 evo, and TLC in general may indeed have an uncurable problem with slowdown after a period of time. This same problem has also been reported in multiple instances for Samsung OEM drives based on the 840 evo TLC technology.GIven that the 850 evo msata line was delayed by Samsung by about a month, it might be possible that the Anandtech review units were actually tested in late Feb and the go-ahead to publish the results only recently provided.
I did also notice that the estimated 'March" timeframe for a new 840 evo firmware has come and passed, as well as no drive magician support for the 850 evo m2/msata drives yet.
Anandtech results for the 1TB 850 evo unit are also quite concerning.
So, I also join the crowd asking for a look at the 850 evo 2.5 and msata drives after some time has passed to see if they suffer from the slowdown problem too.
And a rhetorical, but serious question - does anybody actually have a Samsung TLC drive that has NOT suffered from the slowdown as measured by the proper tools a few months after the drive was formatted/set up?
And kudos to Anandtech - for an SSD review that really tests the drives, not just a run of ATTO or such.
Per Hansson - Wednesday, April 1, 2015 - link
"anything that taxes the drive a bit more may run into the issue, which is basically that the drive stops for up to dozens of seconds (i.e. your system freezes). Until Samsung fixes that, I would advise against buying the 1TB version unless you have a very light workload (web browsing, email, etc.). I suspect it's fixable through a firmware update, but I'll have to wait for Samsung's reply to be sure of that."A wise man once said: if you wait for a firmware fix for your Samsung SSD's you will wait a long time.
He died of old age.
RIP Samsung 840 TLC drives.
Dzungpv - Friday, April 3, 2015 - link
Missing Temperature when idle, full load or stretch, i want this information before buy them .szhosain - Sunday, April 5, 2015 - link
As far as I can tell, you only tested the M.2 version of the Samsung 850 EVO in a 500GB size.Can we assume that the MSATA version of that drive and size will perform essentially identically?
voicequal - Monday, April 13, 2015 - link
Good catch on the poor mSATA 1TB performance during the performance consistency test. It harkens back to the early Jmicron stuttering days. I was similarly affected by the SanDisk U100 a few years ago. The system freezes, particularly when swap file is active, and disk throughput drops to low single digit MB/s. Hard to believe the most modern SSDs can still get into this state. Vanilla benchmarks don't show the problem.