Dell XPS 13 Review
by Brett Howse on February 19, 2015 9:00 AM EST- Posted in
- Laptops
- Dell
- Ultrabook
- Broadwell-U
- XPS 13
System Performance
The XPS 13 is our first look at a notebook with Broadwell-U, which was launched concurrently with this and several other laptops at CES. For a complete look at the launch, check out Ian’s coverage here. The big changes with Broadwell-U over Haswell-U are two things.
First, Intel has moved to the 14nm process, refining their 3D FinFET design. This brings a lot of advantages in terms of power consumption. This is what is called a “Tick” on the Intel Tick-Tock roadmap. Ticks are die-shrinks of the previous “Tock”, which is an architecture update, in this case Haswell. Because this is basically the same CPU architecture, performance gains will be secondary to the reduction in power consumption.
Second, contrary to the CPU architecture, Intel has been iterating the GPU on every new processor. On the 15 watt Core parts, this change results in more execution units (EUs) per GPU, with the HD5500 in the XPS 13 having 23 EUs on the Core i3 model and 24 on the Core i5 and i7. The outgoing Haswell parts had only 20 EUs. This should give a slight bump in GPU power over Haswell, and there may be some other minor differences in the GPUs.
Performance Graphs
For our performance workloads, we set the device to High Performance and then run through some benchmarks to cover a wide range of workloads. For comparison, I will graph it against several of last year’s Haswell-U parts, the Atom based HP Stream 11, and the Dell XPS 15, which has a higher wattage quad-core CPU and discrete GPU. If you would like to compare it against any other device we have tested, please use our online database, Bench.
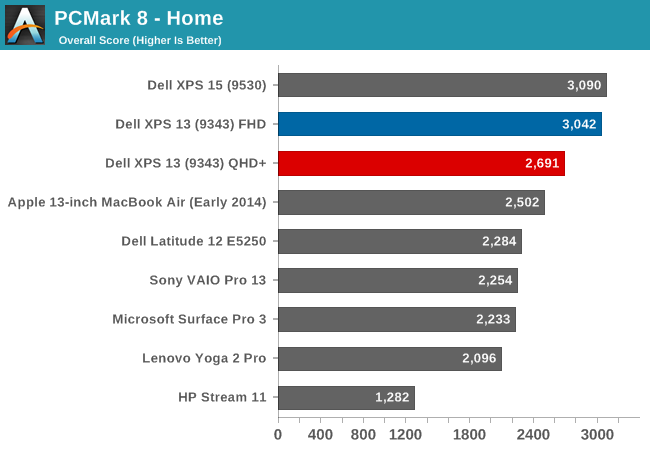
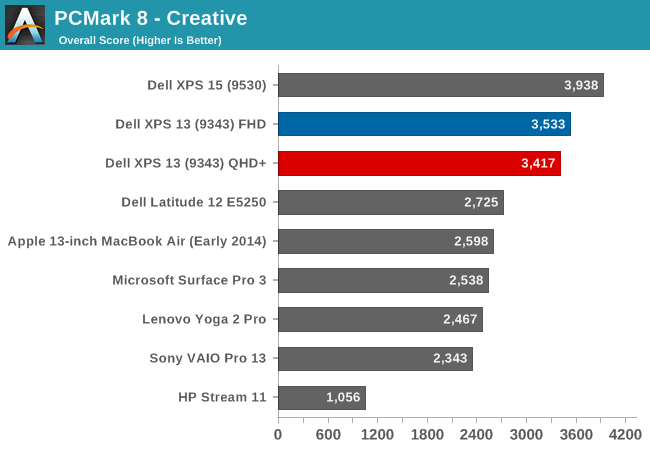
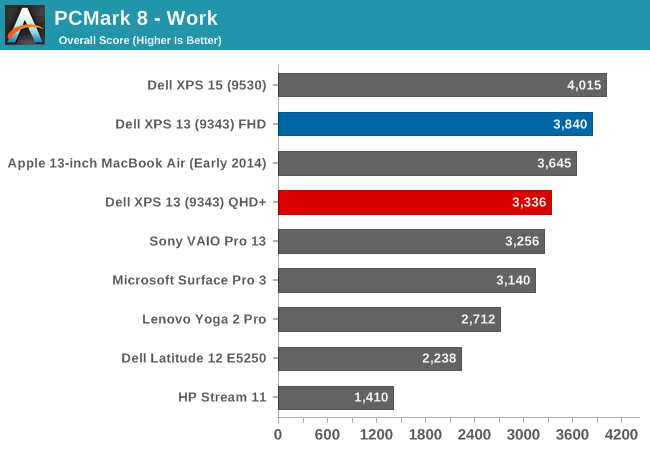
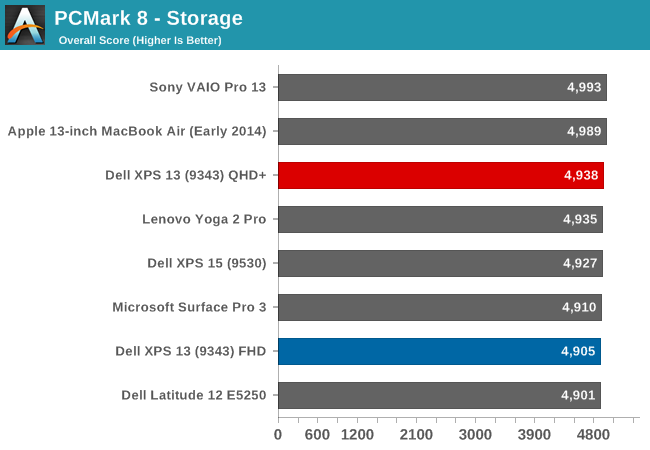
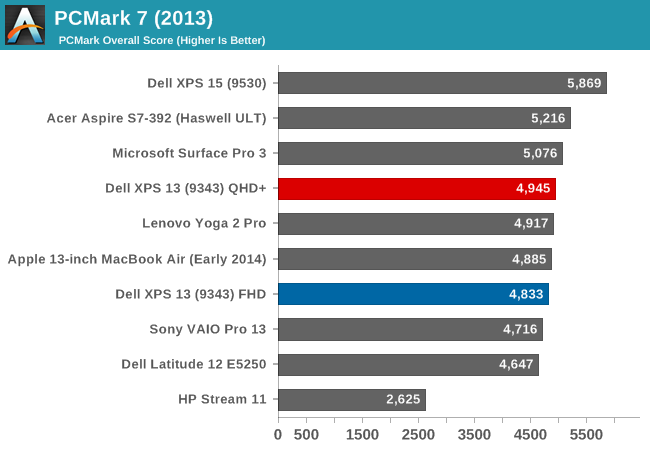
PCMark 8 from Futuremark runs through a variety of tests, and many of the test feature OpenCL support. The Home benchmark runs through what the typical home user would do: web browsing, gaming, and photo editing. Creative is for media and entertainment creation and is more demanding than the Home test. The Work suite tests basic office tasks. The higher resolution model has more work to do on these and scores a bit behind the 1080p model, but overall the new XPS 13 scores quite well on these types of workloads.
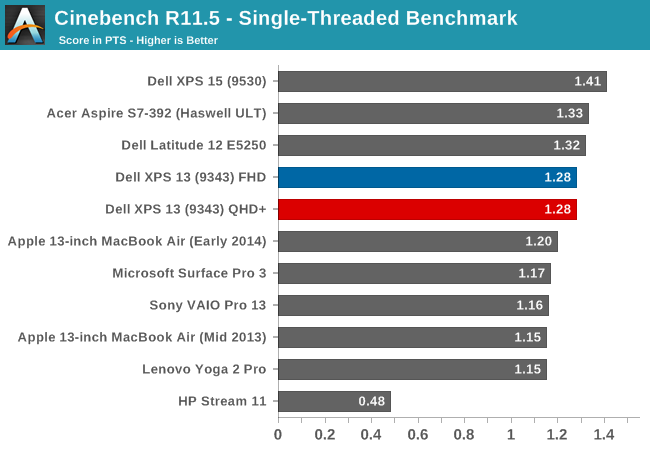
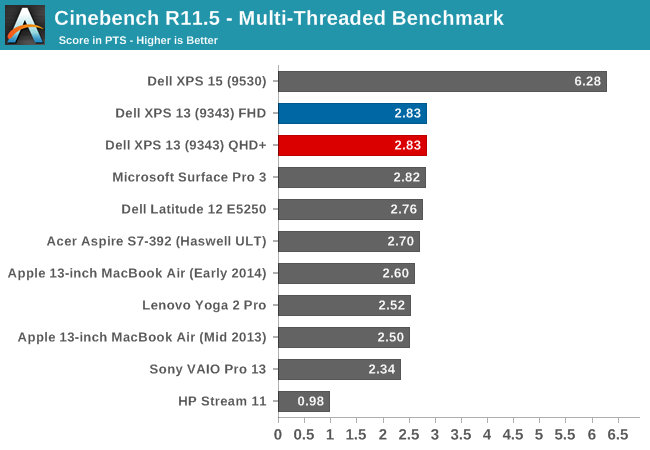
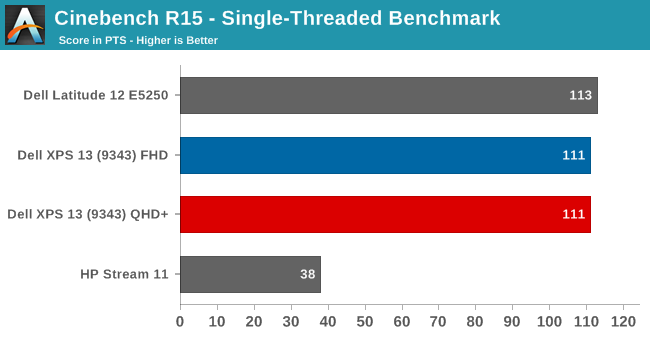
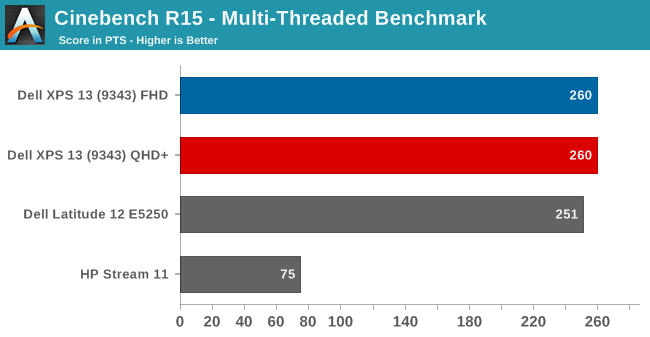
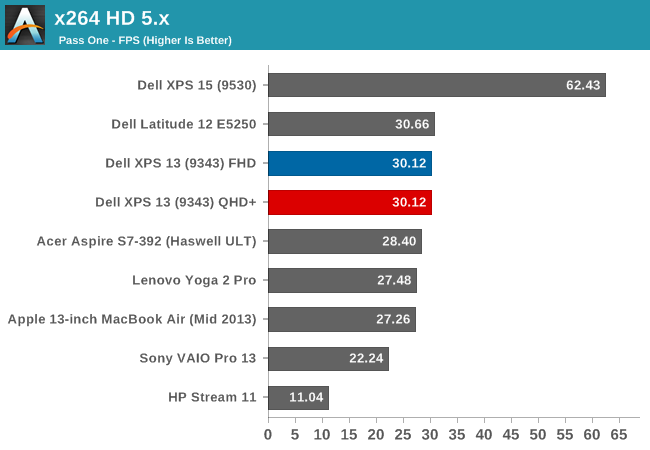
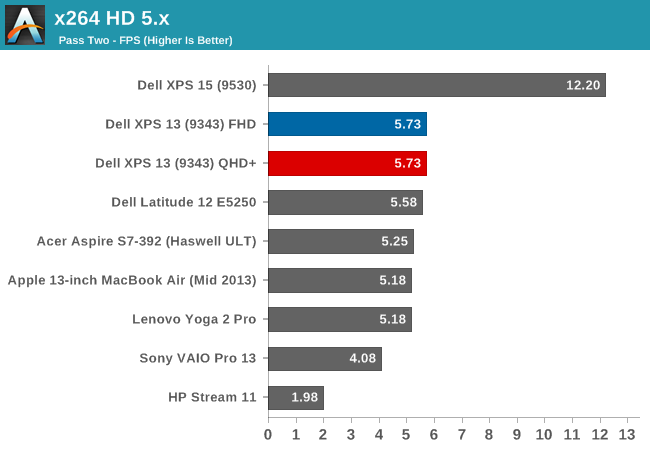
Cinebench tests the CPU's ability to render a scene. Broadwell-U does well here, and though the single core scores show that the i5-5200U is a bit slower than the Acer's i7, and especially the XPS 15 with it's higher TDP part, there is a nice bump up from the i5-4200U in the Lenovo Yoga 2 Pro. Multithreaded is where the new 14nm process can really shine. The lower power usage means that there is more headroom for the CPU to keep the clock speeds higher when all cores are active, and it shows a great result here compared to the Haswell-U series parts. x264 HD also shows favorable results for Broadwell, with the i5-5200U outperforming the old i7-4500U. The Dell XPS 15, with the full quad-core, eight-thread CPU, unsurprisingly outperforms all of the U series CPUs.
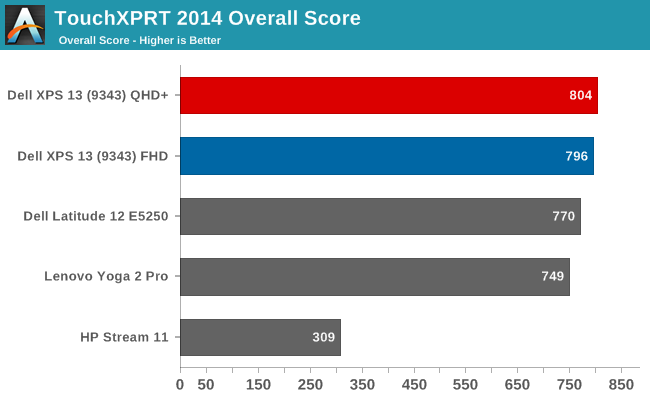
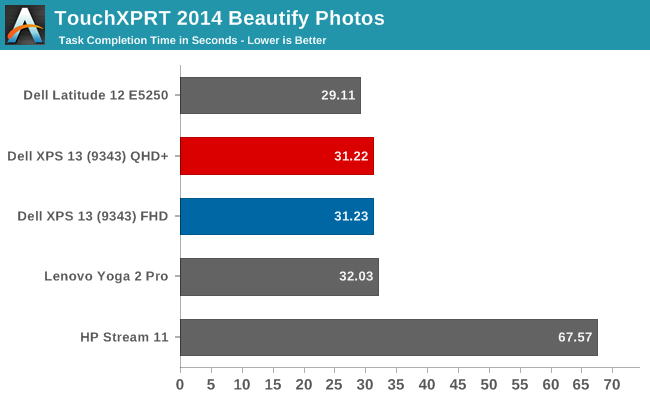
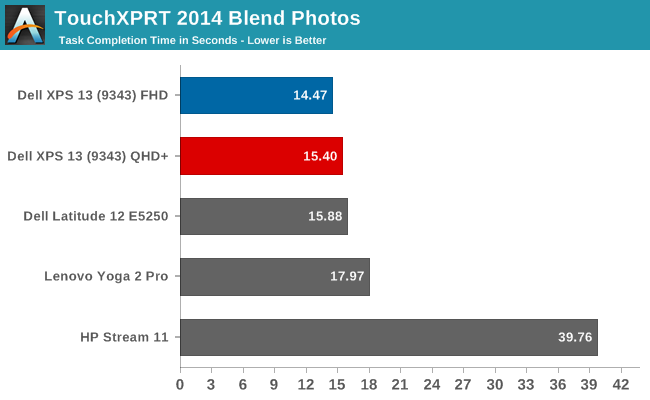
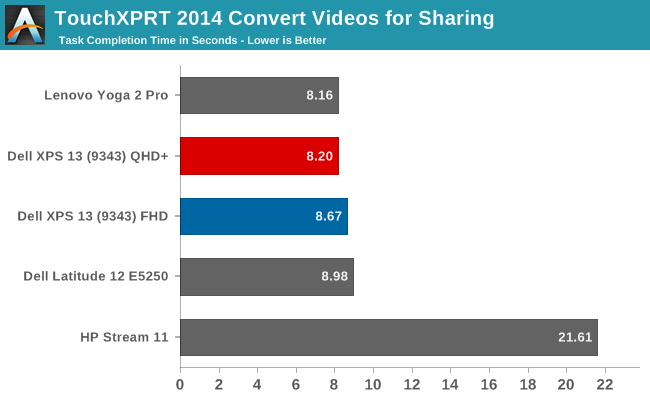
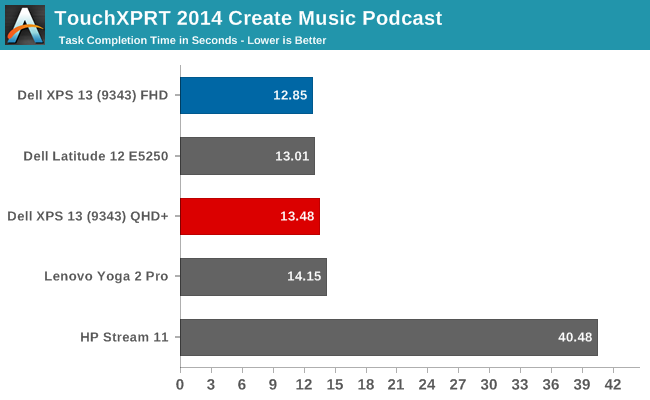
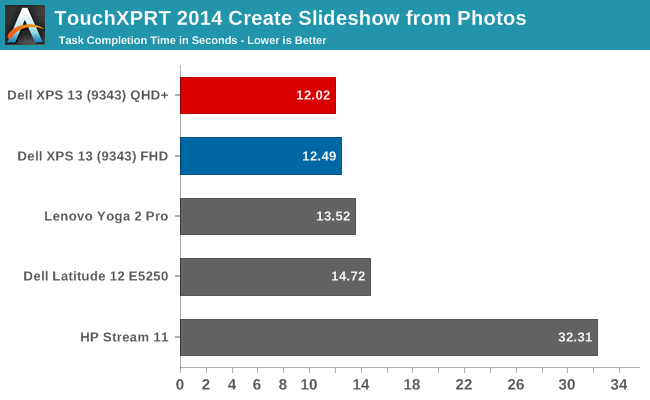
TouchXPRT 2014 is a WinRT app found in the Windows App Store that performs a series of common tasks for a typical home user, and calculates a score based on how quickly the tasks were performed. Here Broadwell seems to perform very similarly to Haswell, with the exception of the video conversion which was quite a bit slower. Update 2015-02-20: Intel has provided us with an updated graphics driver which solves the slow video conversion issue. I have re-run the tests and updated the graphs. If you would like to install this driver from Intel.com, you must first remove the existing one from Programs and Features or you will be blocked from installing, since the version that comes with the device is from Dell.
The Yoga 2 Pro has the Core i5-4200U, and the Dell XPS 13 is the Core i5-5200U, so it makes a good comparison for performance. Overall, the Broadwell based XPS 13 is generally slightly faster than the previous generation processors, but not by much for most single cpu tasks. Multithreaded scenarios show a nice gain in performance with Broadwell just from the ability to keep the clock speeds higher under heavily threaded loads.
As expected, the switch to 14nm did not bring a huge performance change for the CPU, and for that we may have to wait for Skylake, which is the next Tock from Intel (new processor architecture) coming later this year. The Dell XPS 15, with its higher wattage quad-core CPU, shows a clear lead as expected, and the Atom processor in the HP Stream 11 is sorely outclassed.
Interestingly, the FHD model was able to outperform the QHD+ model on a couple of the PCMark 8 tests. I’ve re-ran the benchmarks several times, and these results are consistent. The PCMark tests do include some gaming and other GPU loads which would be slower on the high DPI display.
WiFi
The review units we received both came with the Dell Wireless AC 1560 adapter, which is based on a Broadcom chipset. Originally I had connection issues on 5 GHz with the QHD+ model, but Dell shipped out a driver update which seems to have sorted that, so if you have purchased one of the early model XPS 13s, check Dell’s site for some updates.
Optionally, Dell will outfit the XPS 13 with the Intel Dual Band Wireless-AC 7265 adapter, or the spec sheet also lists the Wireless-N version of this Intel adapter. I have seen and used the AC 7265 on a couple of machines, such as the Dell Latitude 12 E5250, and it performed very well.
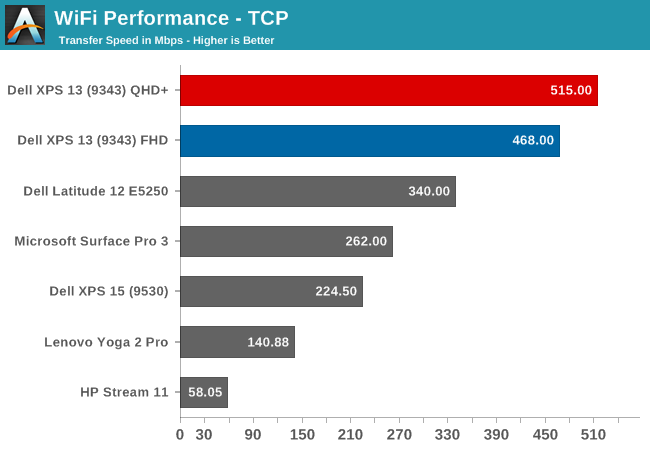
Wireless performance was very good, with the Broadcom chip pulling to the top of the chart. Once the initial connection issues were resolved with the driver update, I had no problems with the wireless connection on the XPS 13.


201 Comments
View All Comments
Fedef - Friday, February 20, 2015 - link
I mean, the different brightness level at witch you test the contrast can't be the cause of a contrast dropping from 1500 to 700, it is almost impossible.And even if that were the case you should take that as a reference because none uses their display at max bright unless outdoor in a sunny day.
Brett Howse - Friday, February 20, 2015 - link
The meter we test the grayscale and color accuracy is not accurate at detecting blacks, so the contrast ratio will go down because of the noise in the sensor thinking that there is more light than there actually is, which is why we use a different meter to test contrast. So yes, just ignore that reading since it is incorrect.Fedef - Friday, February 20, 2015 - link
Thanks for clarifing that.Maybe you should just hide those result to avoid confusion.
srdm - Wednesday, April 22, 2015 - link
This is probably a silly question, but I have been wondering if the very good black levels could to some part be due to the adaptive brightness "feature". Is it right that if you measure the black level on a black screen, then the adaptive brightness would lower the brightness and therefore you would see a better black level? Could that have been the case in your measurements?althaz - Thursday, February 19, 2015 - link
This is a pretty awesome Ultrabook. I prefer the form factor of my Surface Pro, but if I were to begin typing on the go a lot more, this would be right at the top of my list I think. Looks even better than the MBA I offloaded!MadMan007 - Thursday, February 19, 2015 - link
Looking at the model lineup...damn, they missed some pretty compelling options. Gimping the FHD screen in memory and SSD (and to a lesser extent CPU) is a damned shame. So what if the price would overlap with the bottom end of the QHD+ models, the battery life of the FHD screen model is insane; I would bet that one with an i5, 256GB or 512GB SSD, and 8GB of RAM would be extremely popular.Nicky Drake - Thursday, February 19, 2015 - link
There is one: I have a Core i5 model with 8GB of RAM and a 256GB SSD. Availability of models varies a great deal between regions though. I'm in New Zealand. I'm loving the matte screen.tipoo - Thursday, February 19, 2015 - link
So what's the secret to the HD Graphics 5500 doing better than the 5000? It's 24EUs @ 300 - 950 (Boost) MHz, vs 40EUs @ 200 - 1100 (Boost) MHz. These things stay at the boost clock while gaming most of the time, so the base freq difference isn't a huge factor. Near half the EUs, lower max clock, and better performance?tipoo - Thursday, February 19, 2015 - link
I know of all the internal improvements to the Broadwell GPUs, but I thought we were expecting like 20% more squeezed out there, not being able to match a higher clocked 40EU part with a lower clocked 24EU part...I wonder what the 48 EU part with eDRAM will perform like then...
peterfares - Thursday, February 19, 2015 - link
Hurrah for RGB and not PenTile garbage!