Samsung SM951 (512GB) PCIe SSD Review
by Kristian Vättö on February 24, 2015 8:00 AM ESTAnandTech Storage Bench - Heavy
While The Destroyer focuses on sustained and worst-case performance by hammering the drive with nearly 1TB worth of writes, the Heavy trace provides a more typical enthusiast and power user workload. By writing less to the drive, the Heavy trace doesn't drive the SSD into steady-state and thus the trace gives us a good idea of peak performance combined with some basic garbage collection routines.
| AnandTech Storage Bench - Heavy | ||||||||||||
| Workload | Description | Applications Used | ||||||||||
| Photo Editing | Import images, edit, export | Adobe Photoshop | ||||||||||
| Gaming | Pllay games, load levels | Starcraft II, World of Warcraft | ||||||||||
| Content Creation | HTML editing | Dreamweaver | ||||||||||
| General Productivity | Browse the web, manage local email, document creation, application install, virus/malware scan | Chrome, IE10, Outlook, Windows 8, AxCrypt, uTorrent, AdAware | ||||||||||
| Application Development | Compile Chromium | Visual Studio 2008 | ||||||||||
The Heavy trace drops virtualization from the equation and goes a bit lighter on photo editing and gaming, making it more relevant to the majority of end-users.
| AnandTech Storage Bench - Heavy - Specs | ||||||||||||
| Reads | 2.17 million | |||||||||||
| Writes | 1.78 million | |||||||||||
| Total IO Operations | 3.99 million | |||||||||||
| Total GB Read | 48.63 GB | |||||||||||
| Total GB Written | 106.32 GB | |||||||||||
| Average Queue Depth | ~4.6 | |||||||||||
| Focus | Peak IO, basic GC routines | |||||||||||
The Heavy trace is actually more write-centric than The Destroyer is. A part of that is explained by the lack of virtualization because operating systems tend to be read-intensive, be that a local or virtual system. The total number of IOs is less than 10% of The Destroyer's IOs, so the Heavy trace is much easier for the drive and doesn't even overwrite the drive once.
| AnandTech Storage Bench - Heavy - IO Breakdown | |||||||||||
| IO Size | <4KB | 4KB | 8KB | 16KB | 32KB | 64KB | 128KB | ||||
| % of Total | 7.8% | 29.2% | 3.5% | 10.3% | 10.8% | 4.1% | 21.7% | ||||
The Heavy trace has more focus on 16KB and 32KB IO sizes, but more than half of the IOs are still either 4KB or 128KB. About 43% of the IOs are sequential with the rest being slightly more full random than pseudo-random.
| AnandTech Storage Bench - Heavy - QD Breakdown | ||||||||||||
| Queue Depth | 1 | 2 | 3 | 4-5 | 6-10 | 11-20 | 21-32 | >32 | ||||
| % of Total | 63.5% | 10.4% | 5.1% | 5.0% | 6.4% | 6.0% | 3.2% | 0.3% | ||||
In terms of queue depths the Heavy trace is even more focused on very low queue depths with three fourths happening at queue depth of one or two.
I'm reporting the same performance metrics as in The Destroyer benchmark, but I'm running the drive in both empty and full states. Some manufacturers tend to focus intensively on peak performance on an empty drive, but in reality the drive will always contain some data. Testing the drive in full state gives us valuable information whether the drive loses performance once it's filled with data.
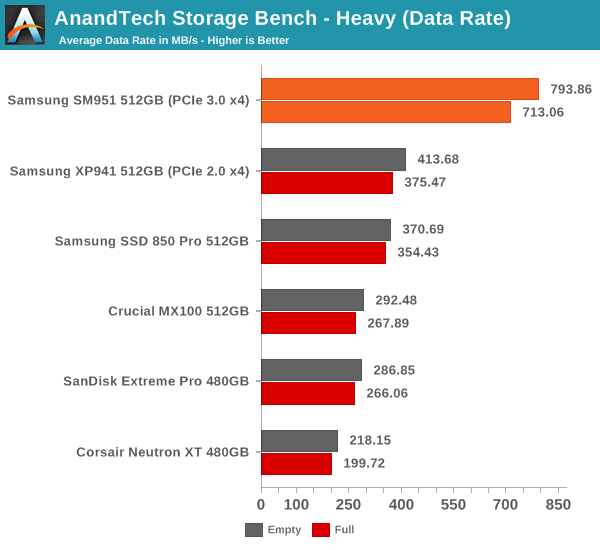
The SM951 performs even strongly in our Heavy trace and presents nearly 100% improvement in data rate over the XP941. In full state the SM951 loses a bit of its performance, but that's normal and the drop isn't any bigger than in other drives. Despite the lack of NVMe, it's starting to be clear that the SM951 is significantly faster than its predecessor and any SATA 6Gbps SSD.
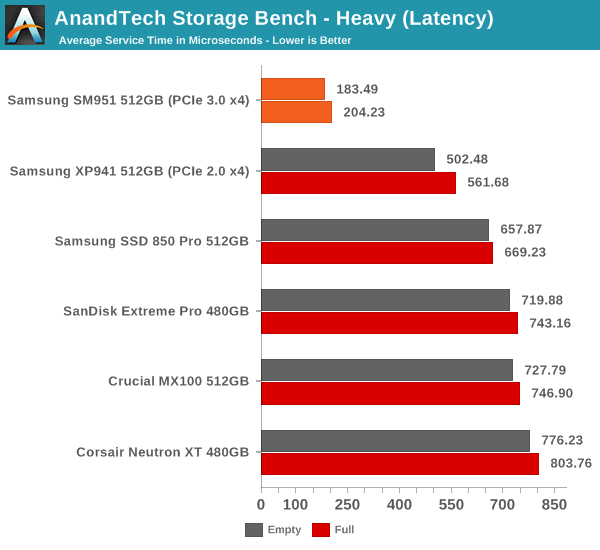
The average latency is also cut in less than half, which is actually a more substantial improvement than going from a SATA 6Gbps drive to the XP941.
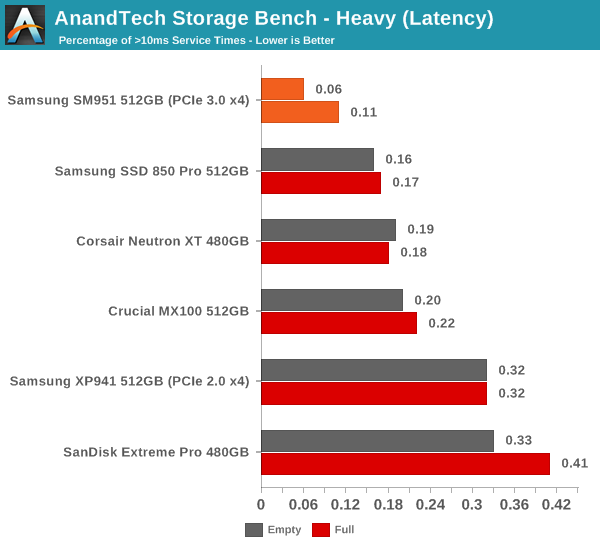
The share of high latency IOs is also the lowest with only 0.06% of the IOs having a higher than 10ms service time.


128 Comments
View All Comments
Makaveli - Tuesday, February 24, 2015 - link
I would love to see two Samsung 850Pro 256GB drives in Raid 0 vs this.BPB - Wednesday, February 25, 2015 - link
I was really hoping to see this compared to a RAID 0 setup. I'm considering getting one of these or a competitor's version in 2 or 3 months, but I'm also considering just getting another Samsung SSD and creating a RAID 0 setup.Flash13 - Tuesday, February 24, 2015 - link
Why trust Samsung? I don't anymore.youtard - Tuesday, February 24, 2015 - link
hurr!icrf - Tuesday, February 24, 2015 - link
Suggestion for the graphs/charts picked from a drop down: make them all have the same scale, so when flipping between them, it's easier to compare from a visual shift. Ideally, it wouldn't be a drop down, but a set of checkboxes that would show/hide each line graph on the same chart to see more than one at once. If you're pre-rendering the charts, I understand how that would be a problem.Edgar_in_Indy - Tuesday, February 24, 2015 - link
It would be a lot easier to get excited about this drive if there were real-world numbers to look at. I find it frustrating that most hard drive reviews don't show some basic load times. You know, how long to boot windows, to load a level in a game, copy a huge file, etc.It would make it much easier to judge the relative performance of drives, and decide whether the results justify the upgrade cost.
willis936 - Wednesday, February 25, 2015 - link
While it requires more technical knowledge from the reader it actually gives a lot more useful info. Time to load windows? Is that on first boot after install? After updates? After 100 programs are installed? After 10 r/w cycles? After the drive isfiles filled? With overprovisioning? I'd personally much rather synthetic tests that cover most cases so you can extrapolate subjective performance from it. You just have to know which workloads line up with which tests.DanNeely - Wednesday, February 25, 2015 - link
Page 2 of the article, section "A Word About Storage Benches and Real World Tests".TLDR version: "Too much background IO for consistent results to be possible."
Edgar_in_Indy - Wednesday, February 25, 2015 - link
From that same section: "I know some of you have criticized our benchmarks due to the lack of real world application tests, but the unfortunate truth is that it's close to impossible to build a reliable test suite that can be executed in real time. Especially if you want to test something else than just boot and application launch times, there is simply too many tasks in the background that cannot be properly controlled to guarantee valid results. "Okay, then. So a complicated real-world test is difficult to duplicate. But why can't we at least have the simple "boot and application launch times" he referenced? And what about a large file copy, like I already mentioned? That's something most people could easily relate to. And time to compress a large group of files? Etc.
If the whole idea of an SSD is to do things faster, then it would be helpful to get a stopwatch involved in these types of review, at least a little bit!
Or if it really is "Mission Impossible" to document any real world speed improvements, then I can't help but wonder if this is kind of like people paying premiums for high-performance memory, with very little real-world return.
zodiacfml - Wednesday, February 25, 2015 - link
Why not do a benchmark of a Windows installation in a virtual machine from a RAM disk?