Samsung SM951 (512GB) PCIe SSD Review
by Kristian Vättö on February 24, 2015 8:00 AM ESTAnandTech Storage Bench - The Destroyer
The Destroyer has been an essential part of our SSD test suite for nearly two years now. It was crafted to provide a benchmark for very IO intensive workloads, which is where you most often notice the difference between drives. It's not necessarily the most relevant test to an average user, but for anyone with a heavier IO workload The Destroyer should do a good job at characterizing performance.
| AnandTech Storage Bench - The Destroyer | ||||||||||||
| Workload | Description | Applications Used | ||||||||||
| Photo Sync/Editing | Import images, edit, export | Adobe Photoshop CS6, Adobe Lightroom 4, Dropbox | ||||||||||
| Gaming | Download/install games, play games | Steam, Deus Ex, Skyrim, Starcraft 2, BioShock Infinite | ||||||||||
| Virtualization | Run/manage VM, use general apps inside VM | VirtualBox | ||||||||||
| General Productivity | Browse the web, manage local email, copy files, encrypt/decrypt files, backup system, download content, virus/malware scan | Chrome, IE10, Outlook, Windows 8, AxCrypt, uTorrent, AdAware | ||||||||||
| Video Playback | Copy and watch movies | Windows 8 | ||||||||||
| Application Development | Compile projects, check out code, download code samples | Visual Studio 2012 | ||||||||||
The table above describes the workloads of The Destroyer in a bit more detail. Most of the workloads are run independently in the trace, but obviously there are various operations (such as backups) in the background.
| AnandTech Storage Bench - The Destroyer - Specs | ||||||||||||
| Reads | 38.83 million | |||||||||||
| Writes | 10.98 million | |||||||||||
| Total IO Operations | 49.8 million | |||||||||||
| Total GB Read | 1583.02 GB | |||||||||||
| Total GB Written | 875.62 GB | |||||||||||
| Average Queue Depth | ~5.5 | |||||||||||
| Focus | Worst case multitasking, IO consistency | |||||||||||
The name Destroyer comes from the sheer fact that the trace contains nearly 50 million IO operations. That's enough IO operations to effectively put the drive into steady-state and give an idea of the performance in worst case multitasking scenarios. About 67% of the IOs are sequential in nature with the rest ranging from pseudo-random to fully random.
| AnandTech Storage Bench - The Destroyer - IO Breakdown | |||||||||||
| IO Size | <4KB | 4KB | 8KB | 16KB | 32KB | 64KB | 128KB | ||||
| % of Total | 6.0% | 26.2% | 3.1% | 2.4% | 1.7% | 38.4% | 18.0% | ||||
I've included a breakdown of the IOs in the table above, which accounts for 95.8% of total IOs in the trace. The leftover IO sizes are relatively rare in between sizes that don't have a significant (>1%) share on their own. Over a half of the transfers are large IOs with one fourth being 4KB in size.
| AnandTech Storage Bench - The Destroyer - QD Breakdown | ||||||||||||
| Queue Depth | 1 | 2 | 3 | 4-5 | 6-10 | 11-20 | 21-32 | >32 | ||||
| % of Total | 50.0% | 21.9% | 4.1% | 5.7% | 8.8% | 6.0% | 2.1% | 1.4 | ||||
Despite the average queue depth of 5.5, a half of the IOs happen at queue depth of one and scenarios where the queue depths is higher than 10 are rather infrequent.
The two key metrics I'm reporting haven't changed and I'll continue to report both data rate and latency because the two have slightly different focuses. Data rate measures the speed of the data transfer, so it emphasizes large IOs that simply account for a much larger share when looking at the total amount of data. Latency, on the other hand, ignores the IO size, so all IOs are given the same weight in the calculation. Both metrics are useful, although in terms of system responsiveness I think the latency is more critical. As a result, I'm also reporting two new stats that provide us a very good insight to high latency IOs by reporting the share of >10ms and >100ms IOs as a percentage of the total.
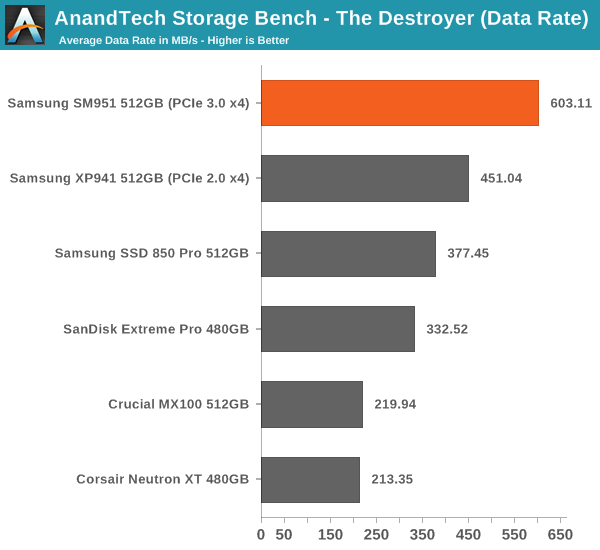
The SM951 takes the lead easily and provides ~34% increase in data rate over the XP941. The advantage over some of the slower SATA 6Gbps drives is nearly threefold, which speaks for the performance benefit that PCIe and especially PCIe 3.0 provide.
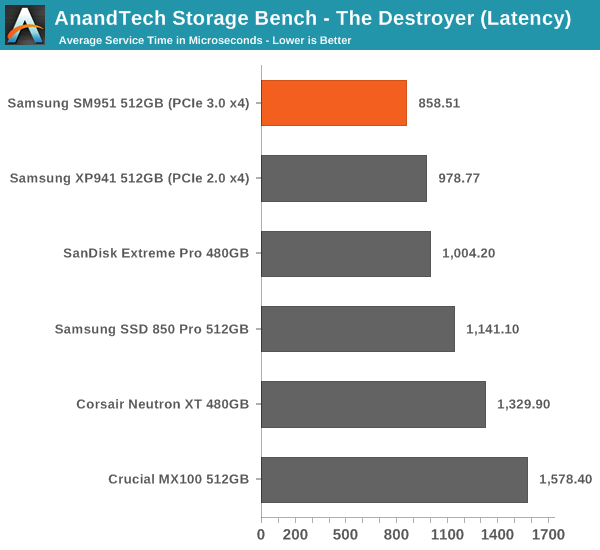
The latency benefit isn't as significant, which suggests that the SM951 provides substantial boost in large IO performance, but the performance at small IO sizes isn't dramatically better.
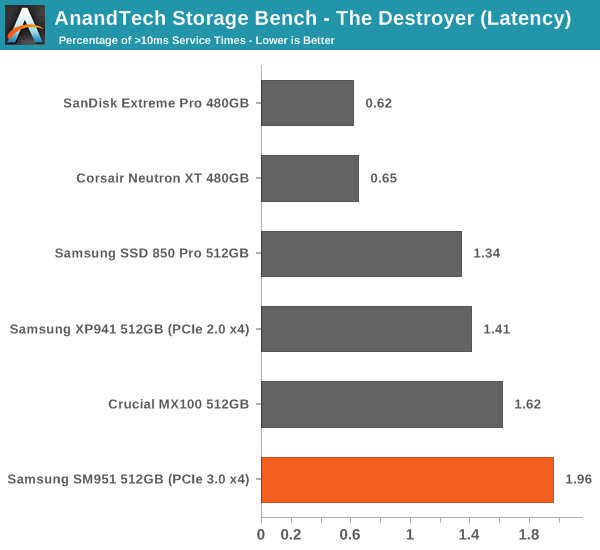
Despite the lowest average latency, the SM951 actually has the most >10ms IO with nearly 2% of the IOs having higher latency than 10ms. I did some thermal throttling testing (see the dedicated page for full results) and the SM951 seems to throttle fairly aggressively, so my hypothesis is that the high number is due to throttling, which limits the drive's throughput momentarily (and hence increases the latency) to cool down the drive.
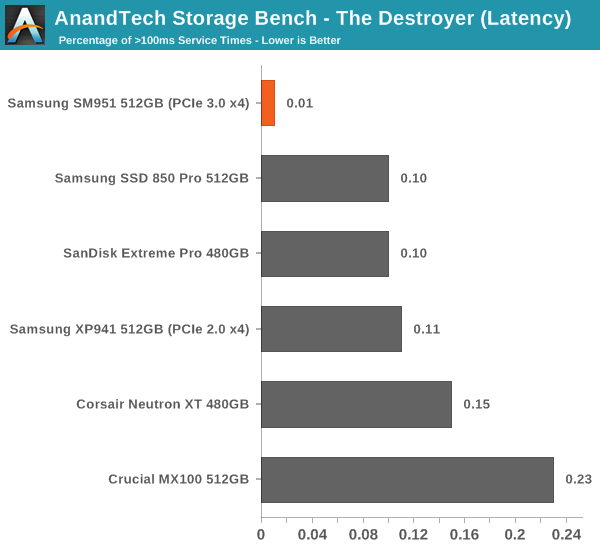
However, the SM951 has the least >100ms IOs, which means that despite the possible throttling the maximum service times stay between 10ms and 100ms.


128 Comments
View All Comments
Makaveli - Tuesday, February 24, 2015 - link
I would love to see two Samsung 850Pro 256GB drives in Raid 0 vs this.BPB - Wednesday, February 25, 2015 - link
I was really hoping to see this compared to a RAID 0 setup. I'm considering getting one of these or a competitor's version in 2 or 3 months, but I'm also considering just getting another Samsung SSD and creating a RAID 0 setup.Flash13 - Tuesday, February 24, 2015 - link
Why trust Samsung? I don't anymore.youtard - Tuesday, February 24, 2015 - link
hurr!icrf - Tuesday, February 24, 2015 - link
Suggestion for the graphs/charts picked from a drop down: make them all have the same scale, so when flipping between them, it's easier to compare from a visual shift. Ideally, it wouldn't be a drop down, but a set of checkboxes that would show/hide each line graph on the same chart to see more than one at once. If you're pre-rendering the charts, I understand how that would be a problem.Edgar_in_Indy - Tuesday, February 24, 2015 - link
It would be a lot easier to get excited about this drive if there were real-world numbers to look at. I find it frustrating that most hard drive reviews don't show some basic load times. You know, how long to boot windows, to load a level in a game, copy a huge file, etc.It would make it much easier to judge the relative performance of drives, and decide whether the results justify the upgrade cost.
willis936 - Wednesday, February 25, 2015 - link
While it requires more technical knowledge from the reader it actually gives a lot more useful info. Time to load windows? Is that on first boot after install? After updates? After 100 programs are installed? After 10 r/w cycles? After the drive isfiles filled? With overprovisioning? I'd personally much rather synthetic tests that cover most cases so you can extrapolate subjective performance from it. You just have to know which workloads line up with which tests.DanNeely - Wednesday, February 25, 2015 - link
Page 2 of the article, section "A Word About Storage Benches and Real World Tests".TLDR version: "Too much background IO for consistent results to be possible."
Edgar_in_Indy - Wednesday, February 25, 2015 - link
From that same section: "I know some of you have criticized our benchmarks due to the lack of real world application tests, but the unfortunate truth is that it's close to impossible to build a reliable test suite that can be executed in real time. Especially if you want to test something else than just boot and application launch times, there is simply too many tasks in the background that cannot be properly controlled to guarantee valid results. "Okay, then. So a complicated real-world test is difficult to duplicate. But why can't we at least have the simple "boot and application launch times" he referenced? And what about a large file copy, like I already mentioned? That's something most people could easily relate to. And time to compress a large group of files? Etc.
If the whole idea of an SSD is to do things faster, then it would be helpful to get a stopwatch involved in these types of review, at least a little bit!
Or if it really is "Mission Impossible" to document any real world speed improvements, then I can't help but wonder if this is kind of like people paying premiums for high-performance memory, with very little real-world return.
zodiacfml - Wednesday, February 25, 2015 - link
Why not do a benchmark of a Windows installation in a virtual machine from a RAM disk?