Samsung SM951 (512GB) PCIe SSD Review
by Kristian Vättö on February 24, 2015 8:00 AM ESTPerformance Consistency
We've been looking at performance consistency since the Intel SSD DC S3700 review in late 2012 and it has become one of the cornerstones of our SSD reviews. Back in the days many SSD vendors were only focusing on high peak performance, which unfortunately came at the cost of sustained performance. In other words, the drives would push high IOPS in certain synthetic scenarios to provide nice marketing numbers, but as soon as you pushed the drive for more than a few minutes you could easily run into hiccups caused by poor performance consistency.
Once we started exploring IO consistency, nearly all SSD manufacturers made a move to improve consistency and for the 2015 suite, I haven't made any significant changes to the methodology we use to test IO consistency. The biggest change is the move from VDBench to Iometer 1.1.0 as the benchmarking software and I've also extended the test from 2000 seconds to a full hour to ensure that all drives hit steady-state during the test.
For better readability, I now provide bar graphs with the first one being an average IOPS of the last 400 seconds and the second graph displaying the standard deviation during the same period. Average IOPS provides a quick look into overall performance, but it can easily hide bad consistency, so looking at standard deviation is necessary for a complete look into consistency.
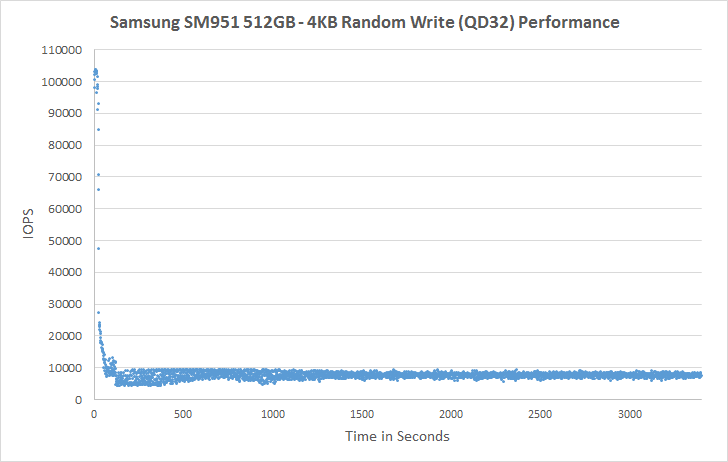
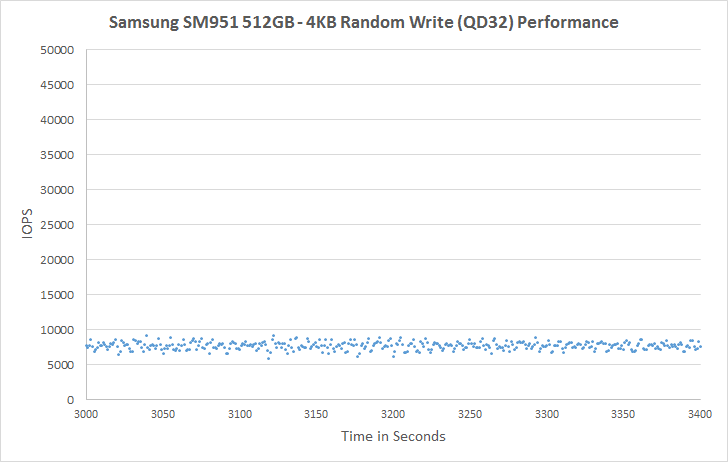
I'm still providing the same scatter graphs too, of course. However, I decided to dump the logarithmic graphs and go linear-only since logarithmic graphs aren't as accurate and can be hard to interpret for those who aren't familiar with them. I provide two graphs: one that includes the whole duration of the test and another that focuses on the last 400 seconds of the test to get a better scope into steady-state performance.
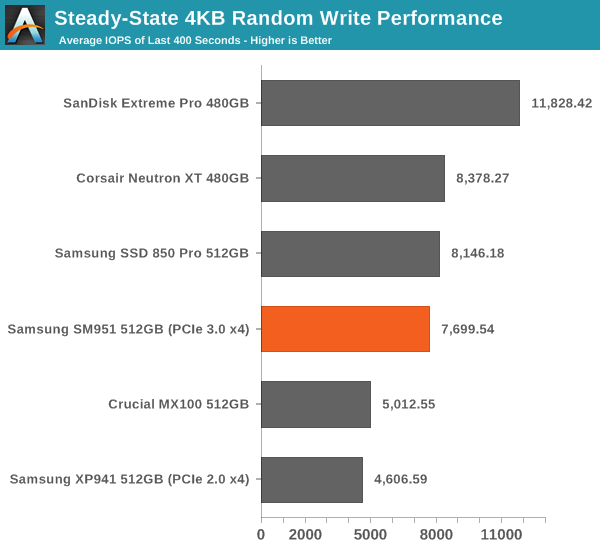
In steady-state performance the SM951 provides a substantial ~70% upgrade over the XP941 and brings performance nearly to the same level with the 850 Pro. Given that the 850 Pro uses faster V-NAND, the steady-state performance is a pleasant surprise and shows that the SM951 is more than a marginal bump from the XP941. Obviously, drives with more default over-provisioning (i.e. Extreme Pro and Neutron XT) provide higher steady-state performance, but Samsung is doing very well with the default 7% over-provisioning.
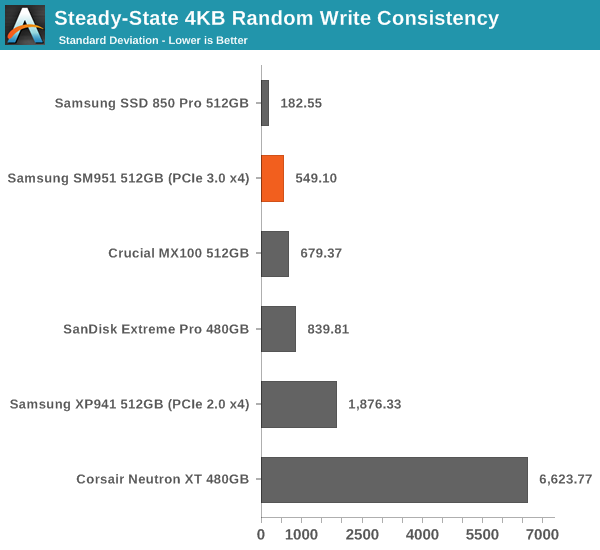
The consistency of the SM951 is also great. The Neutron XT is a living proof of a drive with high average IOPS, but horrible consistency because as we can see in the graph above its standard deviation is up to dozens of times higher compared to the other drives. That's just not acceptable for a modern drive, especially because there are many drives that can consistently provide high IOPS.
 |
|||||||||
| Default | |||||||||
| 25% Over-Provisioning | |||||||||
For a dozen seconds or so, the SM951 is actually able to burst out 100K IOPS, but the performance soon drops to below 10K IOPS and eventually evens out at ~7.5K IOPS. The SM951 is very consistent and doesn't experience any notable IOPS drops, whereas the XP941 regularly drops to a few hundred IOs per second. Increasing the over-provisioning to 25% brings the IOPS to about 35K, which is very decent and again much better than the XP941 that still has odd drops in performance.
 |
|||||||||
| Default | |||||||||
| 25% Over-Provisioning | |||||||||


128 Comments
View All Comments
iLovefloss - Tuesday, February 24, 2015 - link
Samsung's first two TLC drives, the 840 and 840 EVO, has some firmware issues that cause month old data to be read slowly. The severity ranges from slower than a speedy HDD to as slow as a SATA2 SSD. Samsung's first patch didn't resolve the issue for all the 840 EVO SSDs suffering from the slowdowns or only temporarily resolved, so Samsung is in the process of making another patch.kgh00007 - Wednesday, February 25, 2015 - link
I have an 840 EVO and I applied the firmware fix in October last year and the reads have dropped again to below 50MB/s on older data, ie. my OS files and stuff that was installed when I first set the drive up.I will be waiting to see how Samsung handle this before I buy another SSD from them. Benchmarks and reviews mean nothing if an SSD drops below HDD read speeds after a few months of real world use.
Cold boot now takes minutes, not seconds!!
3DoubleD - Wednesday, February 25, 2015 - link
Exactly. I have one drive that has sequential read minimums as low as 8.8MB/s and large portions averaging 50MB/s. Another drive is fine and operates at 300MB/s consistently (although I'm pretty sure that should be higher on SATA3, but day-to-day that is fast enough not to notice). They need to squash this bug if they plan on selling TLC drives in the future in any real volume. Enthusiasts will care, which is admittedly a small market, but I think some laptop vendors might begin to take notice and avoid Samsung TLC products as well, and that's a larger market.Irish_adam - Tuesday, February 24, 2015 - link
So when are they going to make a desktop version with a heatsink on it? It seems like everyone is so obsessed with portables these days that the desktop crowed is getting ignored but surely this kind of performance would mainly be used for a desktop machine than an ultra thin laptop. Its my main gripe with PCIe SSDs atmdananski - Tuesday, February 24, 2015 - link
Same occurred to me. Could probably get a substantial boost in long-running operations by attaching a heatsink. Should be easy enough to do yourself - thermal tape and some old vram heatsinks would probably do the trick without being so heavy as to break the pcie slot.I would like to see the rate of heat dissipation after heavy use (i.e. how that temperature graph looks after you stop writing to the disk). It starts throttling after roughly 180GB sequential, which is plenty for most scenarios, but how long does it take to cool back down again for your next big write? Does throttling occur under more mixed, sustained loads like a database server? Not exactly my kind of use cases, but I'd be interested to see.
DanNeely - Tuesday, February 24, 2015 - link
"However, it's nowhere near the maximum bandwidth of the PCIe 3.0 x4 bus, though, which should be about 3.2GB/s (PCIe only has ~80% efficiency with overhead after the 128b/132b scheme used by PCIe 3.0)."Where's the 20% loss coming from? 128/132 bit encoding only has a 3% overhead, is this an incompletely updated copy/paste from a description of PCIe 2.0? The 8/10bit encoding used in the older version did have a 20% penalty.
Kristian Vättö - Tuesday, February 24, 2015 - link
That's the overhead on top of the encoding scheme and is a rough figure based on our own testing with GPU memory bandwidth that will saturate the interface.It's the same in PCIe 2.0 too: the interface is good for 5GT/s per lane, which equals 500MB/s per lane once you take the 8b/10b encoding and bits to bytes translation into account. However, in real world the best bandwidths I've seen have been about 390MB/s per lane.
extide - Tuesday, February 24, 2015 - link
Protocol overhead (NOT the 120/132b part) -- the commands and stuff, interrupt latency from the cpu and other devices, DMA latencies on read/write to main system memory, etc.Hulk - Tuesday, February 24, 2015 - link
Would it be possible to display the entire AS SSD results window?Kristian Vättö - Tuesday, February 24, 2015 - link
I only run the sequential test, but I can certainly switch to running the full test and publishing the results as a screenshot if that's preferred.