AMD FX-8320E CPU Review: The Other 95W Vishera
by Ian Cutress on January 13, 2015 10:00 AM ESTAMD FX-8320E Overclocking
Sometimes looking at CPU overclocking performance is not that relevant. Each CPU ends up being different, and the plural of anecdote is not ‘data’. At some point it might be useful to sample 100+ CPUs of the same type and gain a proper scientific distribution of overclocks, but even then a sample size of 100 is quite small. So our single point in the ether might not matter too much, but the end result this time around was more than interesting.
To put this into perspective, our recent CPU samples here at AnandTech have been bottom of the barrel for our 24/7 validation methods. Our current i7-5960X does 4.4 GHz on a good day, and our fall-back stock testing model only does 4.2 GHz. Similarly we had an i7-4770K that only did 4.1 GHz – that was particularly shocking. Our last true good overclocker was a Sandy Bridge i7-2600K that did 5.3 GHz with a little push but sat at 5.1 GHz comfortably. Since then, horse plop is a nice word to describe it. However, that changed with our FX-8320E sample when paired with our AM3+ CPU test bed, the 990FX Extreme9.
As the voltage was increased, the frequency increased. It kept going, and going, and going. The Nepton 140XL CPU liquid cooler from CoolerMaster kept the temperature low (when I remembered to plug the fan in), but on the other hand the power started to rise. Almost every bump in frequency required an adjustment in voltage, but the increases were small.
At the end of the day, we rose from a 3.2 GHz base frequency all the way up to 4.8 GHz, a +50% overclock.
Methodology
Our standard overclocking methodology is as follows. We select the automatic overclock options and test for stability with PovRay and OCCT to simulate high-end workloads. These stability tests aim to catch any immediate causes for memory or CPU errors.
For manual overclocks, based on the information gathered from previous testing, starts off at a nominal voltage and CPU multiplier, and the multiplier is increased until the stability tests are failed. The CPU voltage is increased gradually until the stability tests are passed, and the process repeated until the motherboard reduces the multiplier automatically (due to safety protocol) or the CPU temperature reaches a stupidly high level (100ºC+). Our test bed is not in a case, which should push overclocks higher with fresher (cooler) air.
Overclock Results
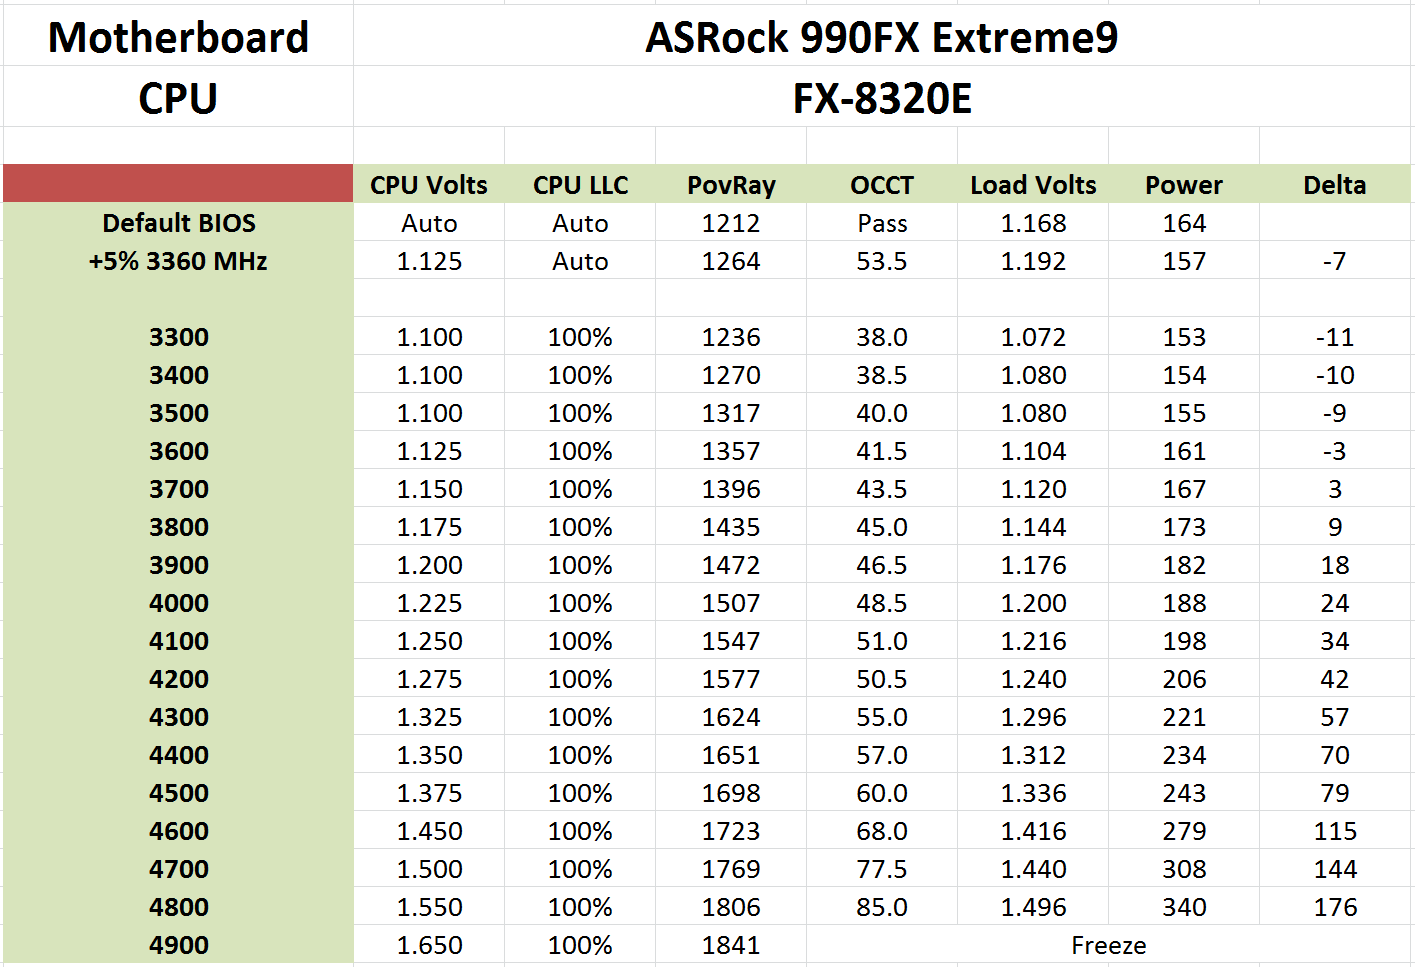
The voltage at 4.8 GHz ran at an alarming 1.550 volts, and the system was stable during our testing when we rested all the benchmarks at this new marker. For 50% extra MHz, our POV-Ray scores jumped from 1212 to 1806, a near 50% jump as well. The only thing that jumped more than 50% was the power consumption. We measured an 86W idle to peak delta when at stock, but the final power was an additional +176W, or +205%, for a total 262W all in, pushing it above the FX-9590's TDP.
Actually in our graphs over the next few pages, the FX-9590 proved to be the best competition when overclocked. That being said, if I were using the CPU 24/7, 1.550 volts at 4.8 GHz would not be the best place to leave it. At 4.5 GHz the CPU only needed 1.375 volts for only a +79W power consumption. Depending on the power delivery of the motherboard, perhaps another couple of notches as well. But all four modules at 4.8 GHz was pretty much unexpected. As always, your mileage may vary.
One argument for our good overclocking sample takes many prongs. A cynic might suggest that this was pre-binned to give a good result, however our past samples from AMD has nothing to suggest that this was particularly special. Karma might suggest that it was just ‘our time’ to get a good sample. A pragmatist would suggest that the FX-8320E is a particularly highly binned part to begin with, and the 30W saving from the regular FX-8320 for only 300 MHz loss might work in its favor depending on how far the voltage curve goes. Again, as stated at the top of this page, it is hard to pin it down without a representative overclocking sample.
Test Setup
| Test Setup | |
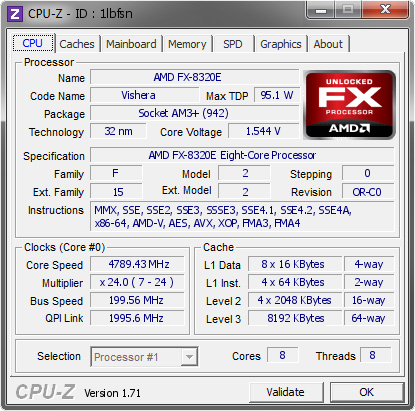
| Processor | AMD FX-8320E 4 Modules, 8 Threads, 3.2 GHz, 4.0 GHz Turbo |
| Motherboards | ASRock 990FX Extreme9 |
| Cooling | Cooler Master Nepton 140XL |
| Power Supply | OCZ 1250W Gold ZX Series Corsair AX1200i Platinum PSU |
| Memory | G.Skill RipjawsZ 4x4 GB DDR3-1866 9-11-9 Kit |
| Memory Settings | XMP |
| Video Cards | MSI GTX 770 Lightning 2GB (1150/1202 Boost) |
| Video Drivers | NVIDIA Drivers 337 |
| Hard Drive | OCZ Vertex 3 256GB |
| Optical Drive | LG GH22NS50 |
| Case | Open Test Bed |
| Operating System | Windows 7 64-bit SP1 |
We are using our ASRock 990FX Extreme9 for testing consistency and comparison, despite AMD sampling the MSI 970 Gaming with this review unit. The motherboard and BIOS can affect the performance quite dramatically, and this keeps our numbers comparable to each other.
Many thanks to...
We must thank the following companies for kindly providing hardware for our test bed:
Thank you to OCZ for providing us with PSUs and SSDs.
Thank you to G.Skill for providing us with memory.
Thank you to Corsair for providing us with an AX1200i PSU.
Thank you to MSI for providing us with the NVIDIA GTX 770 Lightning GPUs.
Thank you to Rosewill for providing us with PSUs and RK-9100 keyboards.
Thank you to ASRock for providing us with some IO testing kit.
Thank you to Cooler Master for providing us with Nepton 140XL CLCs.
Load Delta Power Consumption
Power consumption was tested on the system while in a single MSI GTX 770 Lightning GPU configuration with a wall meter connected to the OCZ 1250W power supply. This power supply is Gold rated, and as I am in the UK on a 230-240 V supply, leads to ~75% efficiency > 50W, and 90%+ efficiency at 250W, suitable for both idle and multi-GPU loading. This method of power reading allows us to compare the power management of the UEFI and the board to supply components with power under load, and includes typical PSU losses due to efficiency.
We take the power delta difference between idle and load as our tested value, giving an indication of the power increase from the CPU when placed under stress.
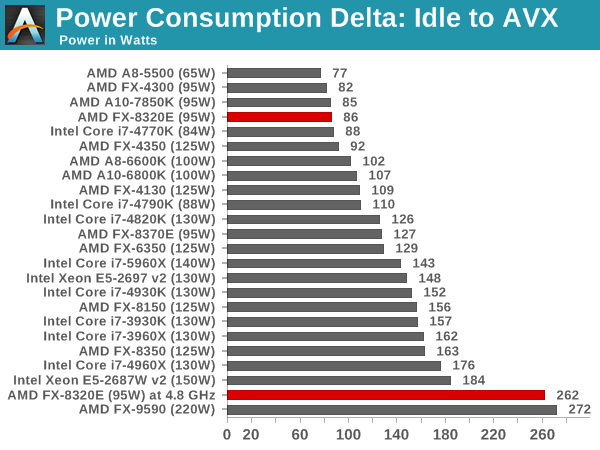
86W undercuts the 95W TDP by a good margin, however one might suggest that the power efficiency difference of the power supply would take that into account. The stock load voltage was 1.168 volts in our motherboard, which does not suggest anything untoward regarding the VID.


92 Comments
View All Comments
OrphanageExplosion - Wednesday, January 14, 2015 - link
I played Crysis 3 on an i3-4130 and an i5-4690K. On the jungle stages, there's a night and day difference. I suspect you would notice the same going from a 3570K down to an FX-6300. Most titles are GPU-bound, but CPU can cause frame-rate drops too.Cryio - Wednesday, January 14, 2015 - link
For Offfice an AMD APU A6 is more than enough.aphroken - Wednesday, January 14, 2015 - link
for office, a calculator and typewriter sufficesbarleyguy - Thursday, January 15, 2015 - link
Lame comment, seriously.My work laptop is a high end i7 (Dell 4800 mobile workstation), and my home office machine is an AMD FX-6300. The AMD machine feels every bit as fast.
For typical office applications, there will be no noticeable difference between an AMD and Intel CPU. The storage is generally the bottleneck, so a fast SSD is more worthwhile upgrade than a faster processor.
Even for development (which is why I have a mobile workstation), it's a barely noticeable difference. The longest part of a build is the unit tests, and they are mostly network bound.
AnandTechLies - Wednesday, January 21, 2015 - link
some guy trying to tell people to waste money on an i7. if you buy an i7 it takes up most of the money (unless you have a shit ton of money) and the rest of the Desktop Suffers and AMD processors are actually GOOD. This IMFORMATIVE website lies and has been caught faking their review benchmarks to make people buy intel over AMD, read my username and LISTEN also do not trust Tomshardware it makes up bullshit toD. Lister - Friday, January 23, 2015 - link
Do you think the regular aluminium foil is as good as a tin foil for making hats? Or can the invisible martian invaders read our thoughts through it?happycamperjack - Tuesday, January 13, 2015 - link
I agree! Complained about this before. These gaming benchmarks are some of the worst games to use for both CPU and GPU beside maybe Tomb Raider. Consumer enthusiast CPU market is pretty much dominated by gamers. If you are running irrelevant benchmarks, what's the point then?Suggestion for games to benchmarks:
Dragon Age Inquision: Incredibly well threaded and scaled. Hyperthreading actually gives a big boost in this game. A good indicator benchmark for upcoming Frostbite 3 engine games.
Crysis 3 or Ryse: Son of Rome: Very well threaded and scaled games. Good benchmarks for upcoming crytek games.
Maybes:
Far Cry 3: I'd suggest Far Cry 4 when it's fixed. Another very well threaded game that's a well representation of open world game.
Metal Gear Ground Zeroes: Good benchmark for upcoming FOX engine games such as the popular Pro Evolution series.
I would also suggest AC Unity if it's not so broken for multi GPUs. Yea SLI and Crossfire is still broken this moment.
MapRef41N93W - Wednesday, January 14, 2015 - link
Tomb Raider is horrible for CPU comparisons. One of the absolute worse GPU intensive games for testing CPU on the market. A Pentium G3258 can almost match a 4770k in that game.OrphanageExplosion - Wednesday, January 14, 2015 - link
Tomb Raider is useful for GPU testing as it's very heavy on GPU ramped up to the max but you're right in that its CPU usage is minimal.OrphanageExplosion - Wednesday, January 14, 2015 - link
I actually played Tomb Raider on a G3258 and a 4790K. With a 4.5GHz OC in place (and v-sync active), the Pentium was a total match for the i7. However, at stock speeds, the Pentium saw clear lag in CPU-heavy area - physics etc.However, the benchmarking sequence doesn't have any physics-heavy elements.
Reviewers need to start actually playing games and finding the bottleneck areas rather than just running canned benchmarks that prove very little. If that means fewer datapoints so be it. I'd rather have a smaller amount of useful data rather than a larger amount of meaningless data.