The Intel Haswell-E CPU Review: Core i7-5960X, i7-5930K and i7-5820K Tested
by Ian Cutress on August 29, 2014 12:00 PM ESTGaming Benchmarks
One of the important things to test in our gaming benchmarks this time around is the effect of the Core i7-5820K having 28 PCIe 3.0 lanes rather than the normal 40. This means that the CPU is limited to x16/x8 operation in SLI, rather than x16/x16.
F1 2013
First up is F1 2013 by Codemasters. I am a big Formula 1 fan in my spare time, and nothing makes me happier than carving up the field in a Caterham, waving to the Red Bulls as I drive by (because I play on easy and take shortcuts). F1 2013 uses the EGO Engine, and like other Codemasters games ends up being very playable on old hardware quite easily. In order to beef up the benchmark a bit, we devised the following scenario for the benchmark mode: one lap of Spa-Francorchamps in the heavy wet, the benchmark follows Jenson Button in the McLaren who starts on the grid in 22nd place, with the field made up of 11 Williams cars, 5 Marussia and 5 Caterham in that order. This puts emphasis on the CPU to handle the AI in the wet, and allows for a good amount of overtaking during the automated benchmark. We test at 1920x1080 on Ultra graphical settings.
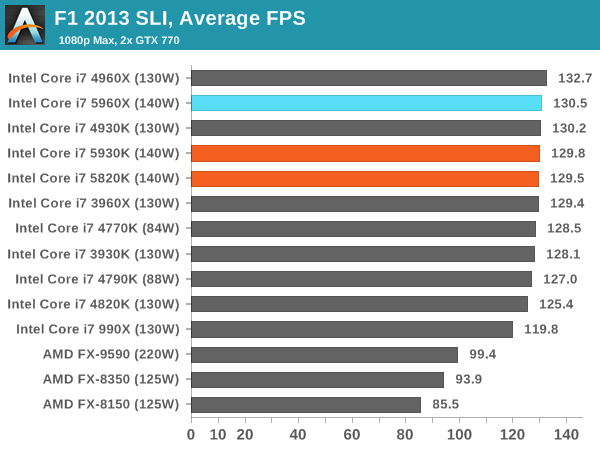
Nothing here really shows any advantage of Haswell-E over Ivy Bridge-E, although the 10% gaps to the 990X for minimum frame rates offer some perspective.
Bioshock Infinite
Bioshock Infinite was Zero Punctuation’s Game of the Year for 2013, uses the Unreal Engine 3, and is designed to scale with both cores and graphical prowess. We test the benchmark using the Adrenaline benchmark tool and the Xtreme (1920x1080, Maximum) performance setting, noting down the average frame rates and the minimum frame rates.

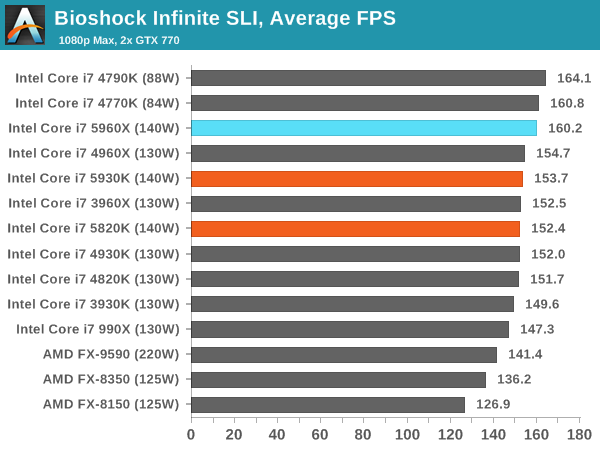
Bioshock Infinite likes a mixture of cores and frequency, especially when it comes to SLI.
Tomb Raider
The next benchmark in our test is Tomb Raider. Tomb Raider is an AMD optimized game, lauded for its use of TressFX creating dynamic hair to increase the immersion in game. Tomb Raider uses a modified version of the Crystal Engine, and enjoys raw horsepower. We test the benchmark using the Adrenaline benchmark tool and the Xtreme (1920x1080, Maximum) performance setting, noting down the average frame rates and the minimum frame rates.

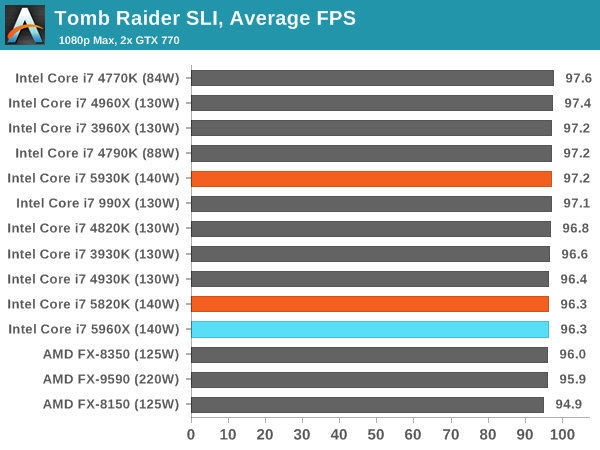
Tomb Raider is blissfully CPU agnostic it would seem.
Sleeping Dogs
Sleeping Dogs is a benchmarking wet dream – a highly complex benchmark that can bring the toughest setup and high resolutions down into single figures. Having an extreme SSAO setting can do that, but at the right settings Sleeping Dogs is highly playable and enjoyable. We run the basic benchmark program laid out in the Adrenaline benchmark tool, and the Xtreme (1920x1080, Maximum) performance setting, noting down the average frame rates and the minimum frame rates.

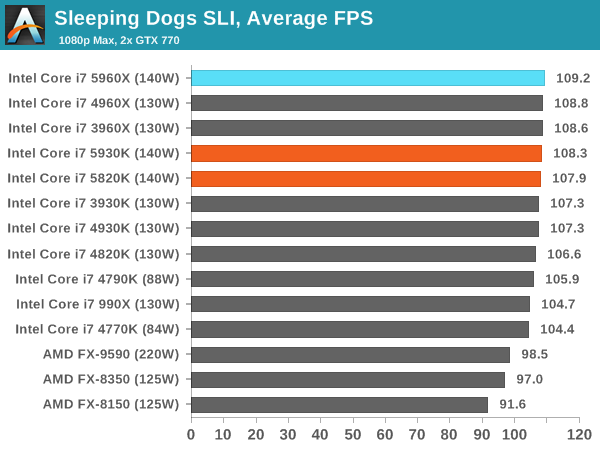
The biggest graph of CPU performance change is the minimum frame rate while in SLI - the 5960X reaches 67.4 FPS minimum, with only the xx60X CPUs of each generation moving above 60 FPS. That being said, all the Intel CPUs in our test are above 55 FPS, though it would seem that the 60X processors have some more room.
Battlefield 4
The EA/DICE series that has taken countless hours of my life away is back for another iteration, using the Frostbite 3 engine. AMD is also piling its resources into BF4 with the new Mantle API for developers, designed to cut the time required for the CPU to dispatch commands to the graphical sub-system. For our test we use the in-game benchmarking tools and record the frame time for the first ~70 seconds of the Tashgar single player mission, which is an on-rails generation of and rendering of objects and textures. We test at 1920x1080 at Ultra settings.

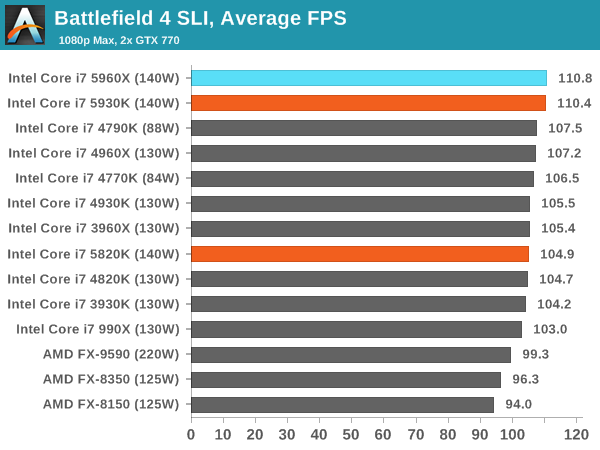
Battlefield 4 is the only benchmark where we see the 5820K with its 28 PCIe lanes down by any reasonable margin against the other two 5xxx processors, and even then this is around 5% when in SLI. Not many users will notice the difference between 105 FPS and 110 FPS, and minimum frame rates are still 75 FPS+ on all Intel processors.


203 Comments
View All Comments
avikbellic911 - Wednesday, January 28, 2015 - link
i am a very happy owner of i7 4960x.....i think x79 boards still win over the x99's i mean x79 can still run like 2800+3100Mhz Rams without Much of Overclocking....I know technology must move on but i fell like x99 is still not much worth at all.....x99 is about 7% improvement is performance if we compare with x79Visibilities - Friday, April 10, 2015 - link
Obviously higher OC'ing is good... But, you guys can have fun with your QUAD core 2500k, and a memory bandwidth of 21GB/s... While the 5960x has EIGHT cores, and three times (3x) the bandwidth... Enjoy the 2500k (xmoheban79 - Tuesday, September 1, 2015 - link
I wish when they were comparing the 5820k to 5930k cpu the clockrates were adjusted to be the same while benching SLI gamings 770 GTX scores so you could see the real difference between 16/8 and 16/16 available lanes on performance because I can't tell if that 5% difference is due to the higher clock speed or not. Also wouldn't hurt to use a Titan instead to max out those lanes.