The Intel Haswell-E CPU Review: Core i7-5960X, i7-5930K and i7-5820K Tested
by Ian Cutress on August 29, 2014 12:00 PM ESTLoad Delta Power Consumption
Power consumption was tested on the system while in a single MSI GTX 770 Lightning GPU configuration with a wall meter connected to the OCZ 1250W power supply. This power supply is Gold rated, and as I am in the UK on a 230-240 V supply, leads to ~75% efficiency under 50W and 90%+ efficiency at 250W, suitable for both idle and multi-GPU loading. This method of power reading allows us to compare the power management of the UEFI and the board to supply components with power under load, and includes typical PSU losses due to efficiency.
We take the power delta difference between idle and load as our tested value, giving an indication of the power increase from the CPU when placed under stress. Unfortuantely we were not in a position to test the power consumption for the two 6-core CPUs due to the timing of testing.
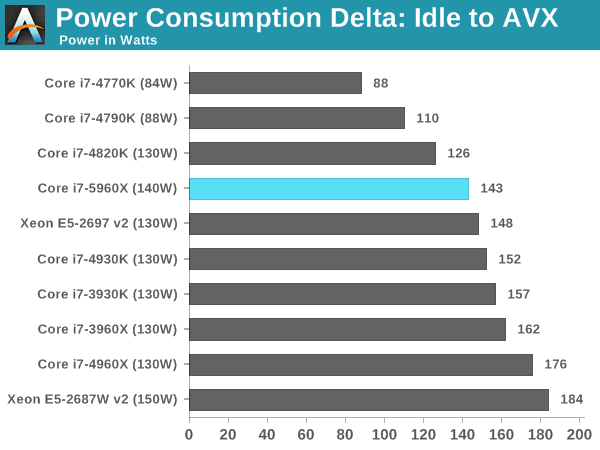
Because not all processors of the same designation leave the Intel fabs with the same stock voltages, there can be a mild variation and the TDP given on each CPU is understandably an absolute stock limit. Due to power supply efficiencies, we get higher results than TDP, but the more interesting results are the comparisons. The 5960X is coming across as more efficient than Sandy Bridge-E and Ivy Bridge-E, including the 130W Ivy Bridge-E Xeon.
Test Setup
| Test Setup | ||||
| Processor |
Intel Core i7-5820K Intel Core i7-5930K Intel Core i7-5960X |
6C/12T 6C/12T 8C/16T |
3.3 GHz / 3.6 GHz 3.5 GHz / 3.7 GHz 3.0 GHz / 3.5 GHz |
|
| Motherboard |
ASUS X99 Deluxe ASRock X99 Extreme4 |
|||
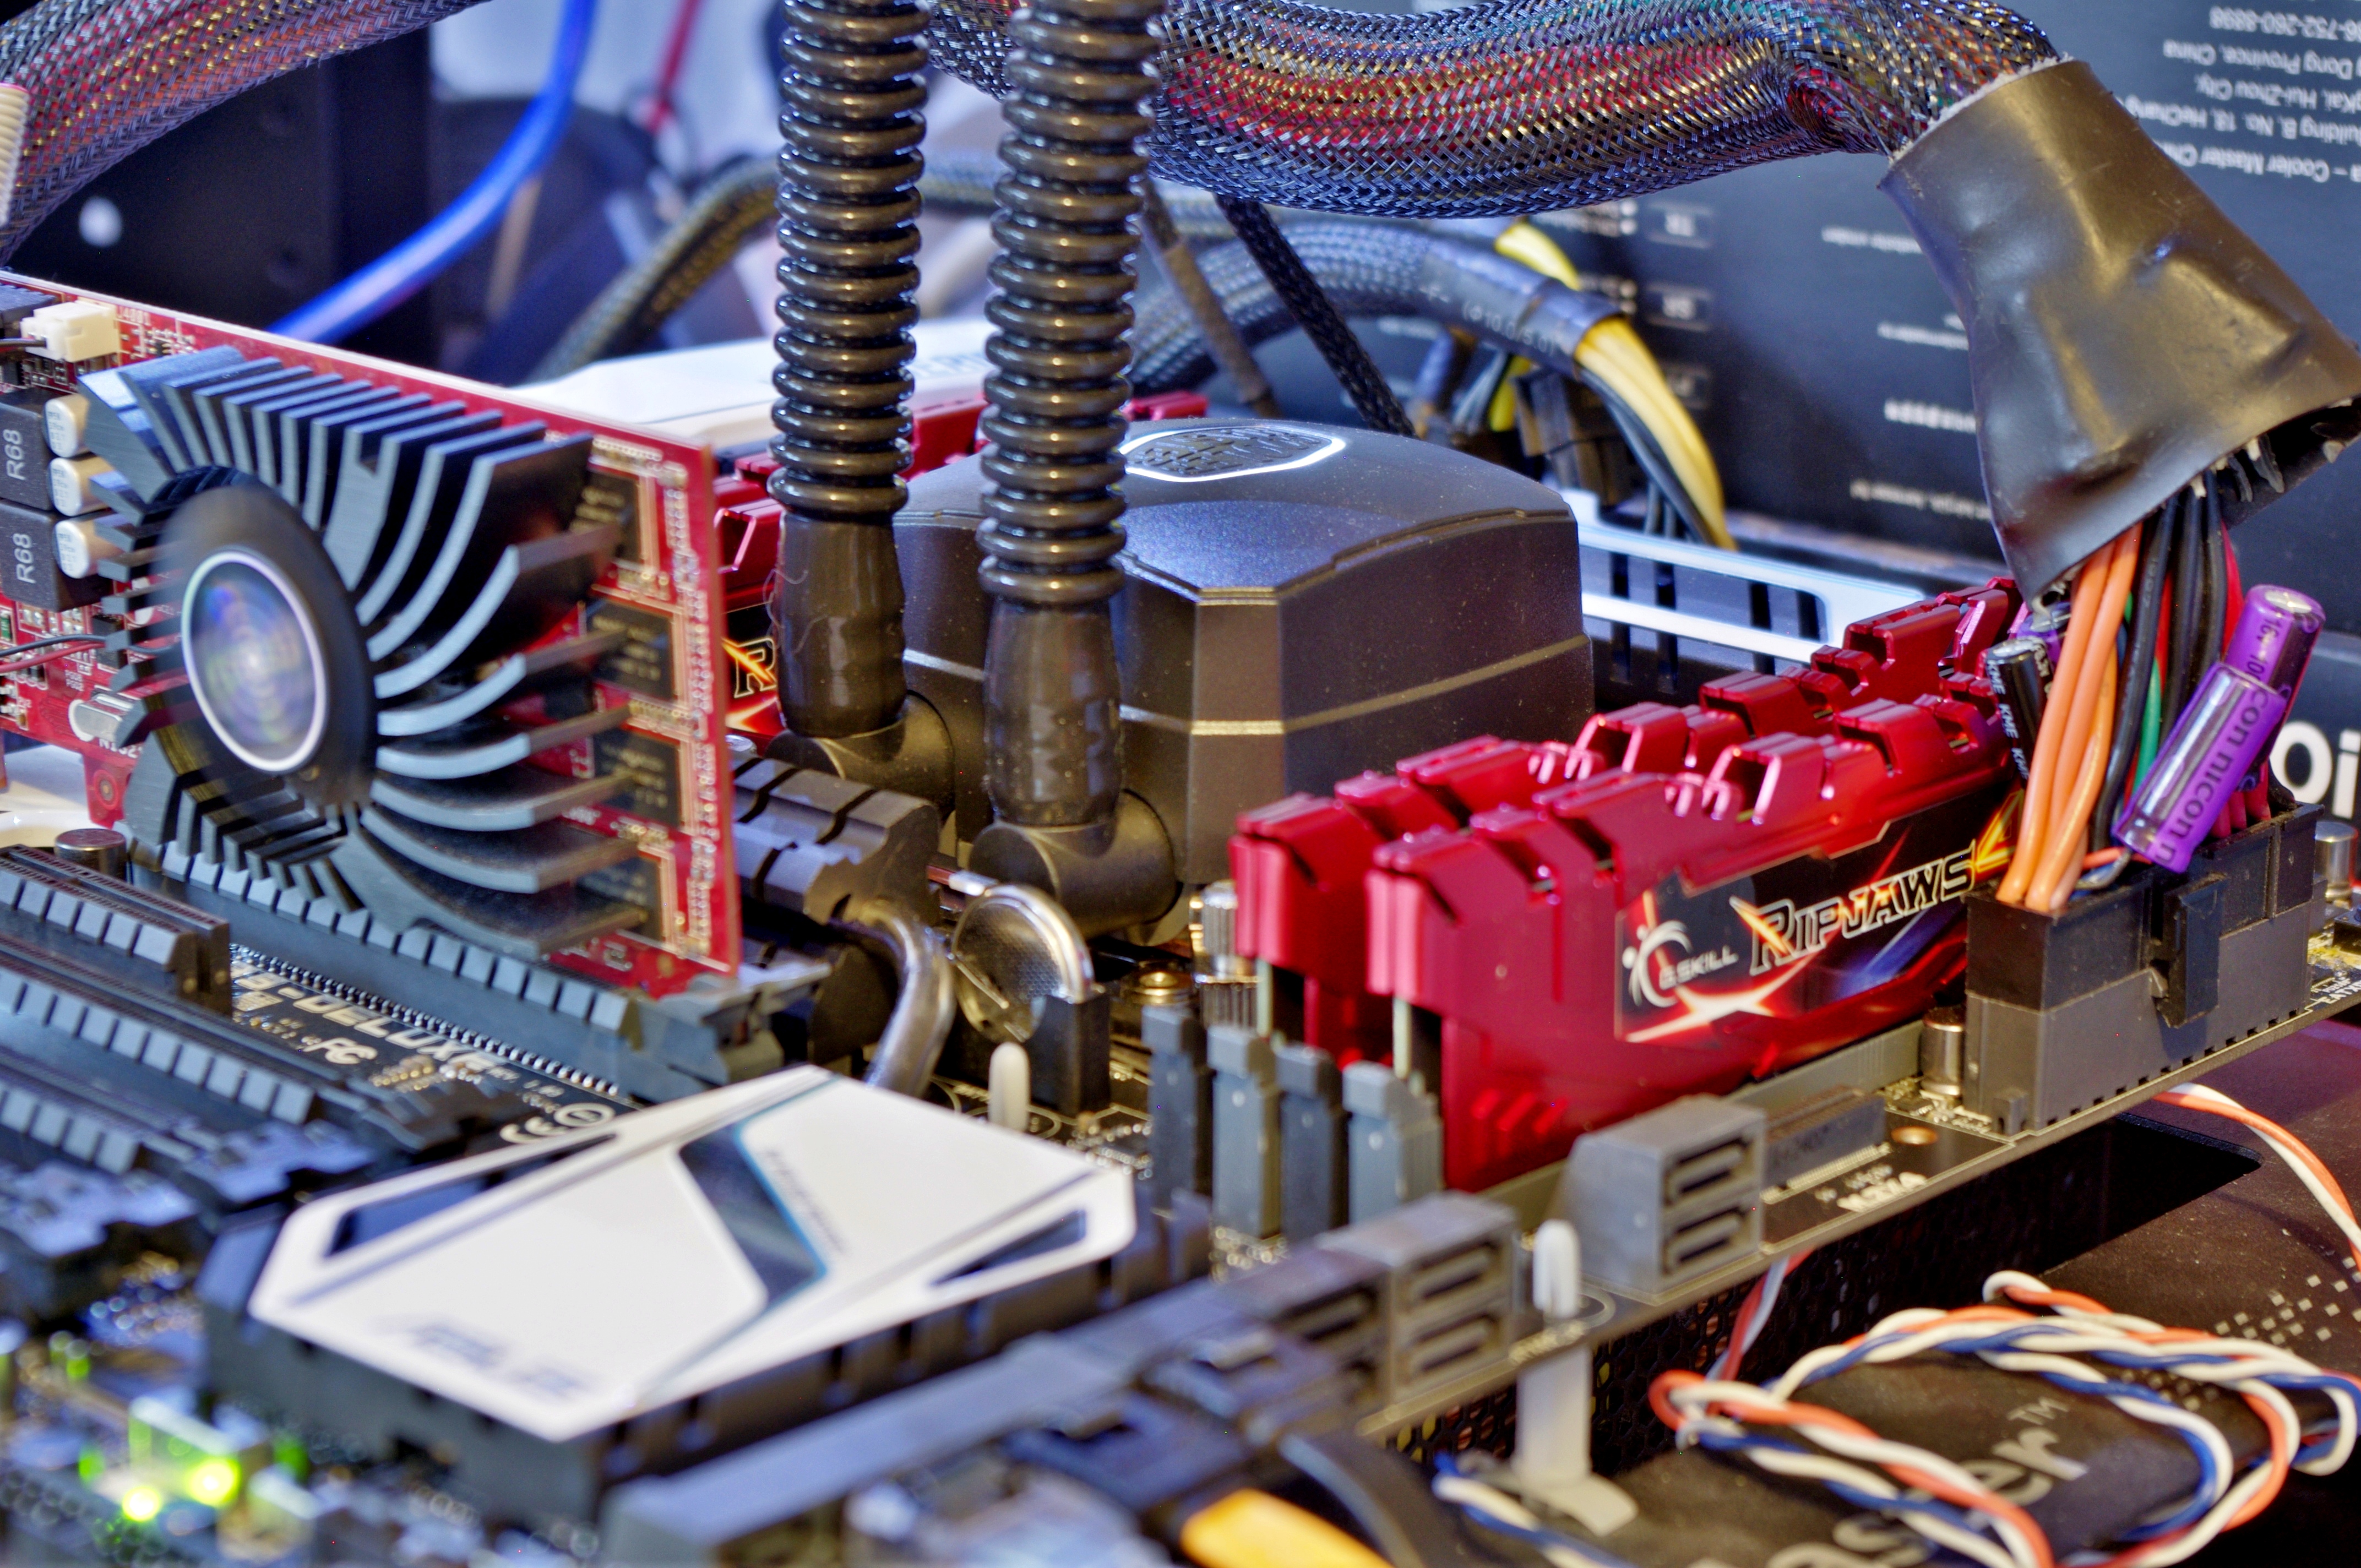
| Cooling |
Corsair H80i Cooler Master Nepton 140XL |
|||
| Power Supply |
OCZ 1250W Gold ZX Series Corsair AX1200i Platinum PSU |
1250W 1200W |
80 PLUS Gold 80 PLUS Platinum |
|
| Memory |
Corsair 4x8 GB G.Skill Ripjaws4 |
DDR4-2133 DDR4-2133 |
15-15-15 1.2V 15-15-15 1.2V |
|
| Memory Settings | JEDEC | |||
| Video Cards | MSI GTX 770 Lightning 2GB (1150/1202 Boost) | |||
| Video Drivers | NVIDIA Drivers 337.88 | |||
| Hard Drive | OCZ Vertex 3 | |||
| Optical Drive | LG GH22NS50 | |||
| Case | Open Test Bed | |||
| Operating System | Windows 7 64-bit SP1 | |||
| USB 2/3 Testing | OCZ Vertex 3 240GB with SATA->USB Adaptor | |||
Many thanks to...
We must thank the following companies for kindly providing hardware for our test bed:
Thank you to OCZ for providing us with PSUs and SSDs.
Thank you to G.Skill for providing us with memory.
Thank you to Corsair for providing us with an AX1200i PSU and a Corsair H80i CLC.
Thank you to MSI for providing us with the NVIDIA GTX 770 Lightning GPUs.
Thank you to Rosewill for providing us with PSUs and RK-9100 keyboards.
Thank you to ASRock for providing us with some IO testing kit.
Thank you to Cooler Master for providing us with Nepton 140XL CLCs and JAS minis.
A quick word to the manufacturers who sent us the extra testing kit for review, including G.Skill’s Ripjaws 4 DDR4-2133 CL15, Corsair for similar modules, and Cooler Master for the Nepton 140XL CLCs. We will be reviewing the DDR4 modules in due course, including Corsair's new extreme DDR4-3200 kit, but we have already tested the Nepton 140XL in a big 14-way CLC roundup. Read about it here.


203 Comments
View All Comments
Michael REMY - Friday, August 29, 2014 - link
again, in your table of extreme core i7 cpus, you forgot the last 4-core Nehalem which is : the i7-975X at 3.3GHz .No, the 965X is not the latest 4-core extreme !
Death666Angel - Friday, August 29, 2014 - link
Considering this would have cost me ~340€ over my i7-4770K (which I have @ 4.5GHz and delidded), because of the price difference in CPU and the fact that I had a 1150 socket mainboard from my retired mining rig, I'm not too salty about it. At least it is 6 core at the low end, that is encouraging. I've been mostly fine with my i7-860 so I guess the i7-4770k will serve me a while.Death666Angel - Saturday, August 30, 2014 - link
"With ASUS motherboards, they have implemented a new onboard button which tells 2x/3x GPU users which slots to go in with LEDs on the motherboard to avoid confusion."Because looking stuff up in the manual is way too complicated!
anactoraaron - Friday, August 29, 2014 - link
The 5820 can be had for $299 at micro center and they will also discount a compatible motherboard by $40. Jus' sayin'. IDK if there's some kind of ad agreement, etc for listing Newegg's price... Anyone shopping for anything should always shop around.tuxRoller - Friday, August 29, 2014 - link
"Very few PC games lose out due to having PCIe 3.0 x8 over PCIe 3.0 x16"Any? Even BF4 might be more due to other factors. It might be more useful to determine these bottlenecks with uhd.
Ian Cutress - Monday, September 1, 2014 - link
I want to try with UHD. Need the monitors though.Mr Perfect - Friday, August 29, 2014 - link
I realize you where trying to CPU limit the benchmarks by using such a low resolution, but does this still hold up when running, say, three 1440p monitors? Wouldn't that be the time when the GPUs are maxed out and start shuttling large amounts of data between themselves?
Ian Cutress - Monday, September 1, 2014 - link
I want to test with higher resolutions in the near future, although my monitor situation is not as fruitful as I would hope. There is no big AnandTech warehouse, we all work in our corner of the world so shipping around this HW is difficult.KAlmquist - Friday, August 29, 2014 - link
"The move to DDR4 2133 C15 would seem to have latency benefits over previous DDR3-1866 and DDR3-1600 implementations as well."If my math is correct, this is wrong. With DDR4 2133 timings of 15-15-15, each of those 15's corresponds to 14.1 nanoseconds. (Divide 2133 by two to get the actual frequency, then divide the clock count by the frequency.) With DDR3 1600 and the common 9-9-9 timings, each time is only 11.25 nanoseconds. With DDR3, the actual transfer of the data takes four clock cycles (there are eight transfers, but "DDR" stands for "double data rate" meaning that there are two transfers per clock cycle). That translates to 5 nanonseconds on DDR3 1600. DDR4 transfers twice as much data at a time, so with DDR4 2133 a transfer takes eight clock cycles or 7.5 nanoseconds. So DDR3 1600 has lower latency than the DDR4 2133 memory.
So why does Sandra report a memory latency of around 28.75 nanoseconds (92 clock cycles at 3.2 Ghz) as shown in the chart on page 2 of this review? If a bank does not have an open page, then the memory latency should be 15+15+8 clock cycles, or 35.6 nanoseconds, not counting the latency internal to the processor. So the Sandra benchmark result seems implausible to me. As far as I can tell, the source code for the Sandra benchmark is not available so there is no way to tell exactly what it is measuring.
JumpingJack - Monday, September 1, 2014 - link
Good points.