Samsung SSD 845DC EVO/PRO Performance Preview & Exploring IOPS Consistency
by Kristian Vättö on September 3, 2014 8:00 AM ESTPerformance Consistency - Worst-Case IOPS
In the past we have only reported average IOPS in one second intervals, which gives us a good picture of overall performance. With modern SSDs, however, there are tens of thousands of IOs happening every second and the fundamental problem with averages is that they do not show how the performance varies and what the worst-case performance is.
Especially in enterprise environments, the worst-case performance can be more salient because the drives operate in an array, which scales the overall performance but also makes worst-case performance drops more significant. For example, if you have a 12-drive array of SSDs that each provide 50K IOPS on average, the theoretical maximum speed of that array would be 600K IOPS. However, if the worst-case performance of each drive is 5K IOPS, the worst-case performance of the array can suddenly drop to 60K IOPS, which can be significant enough to have an impact on user experience.
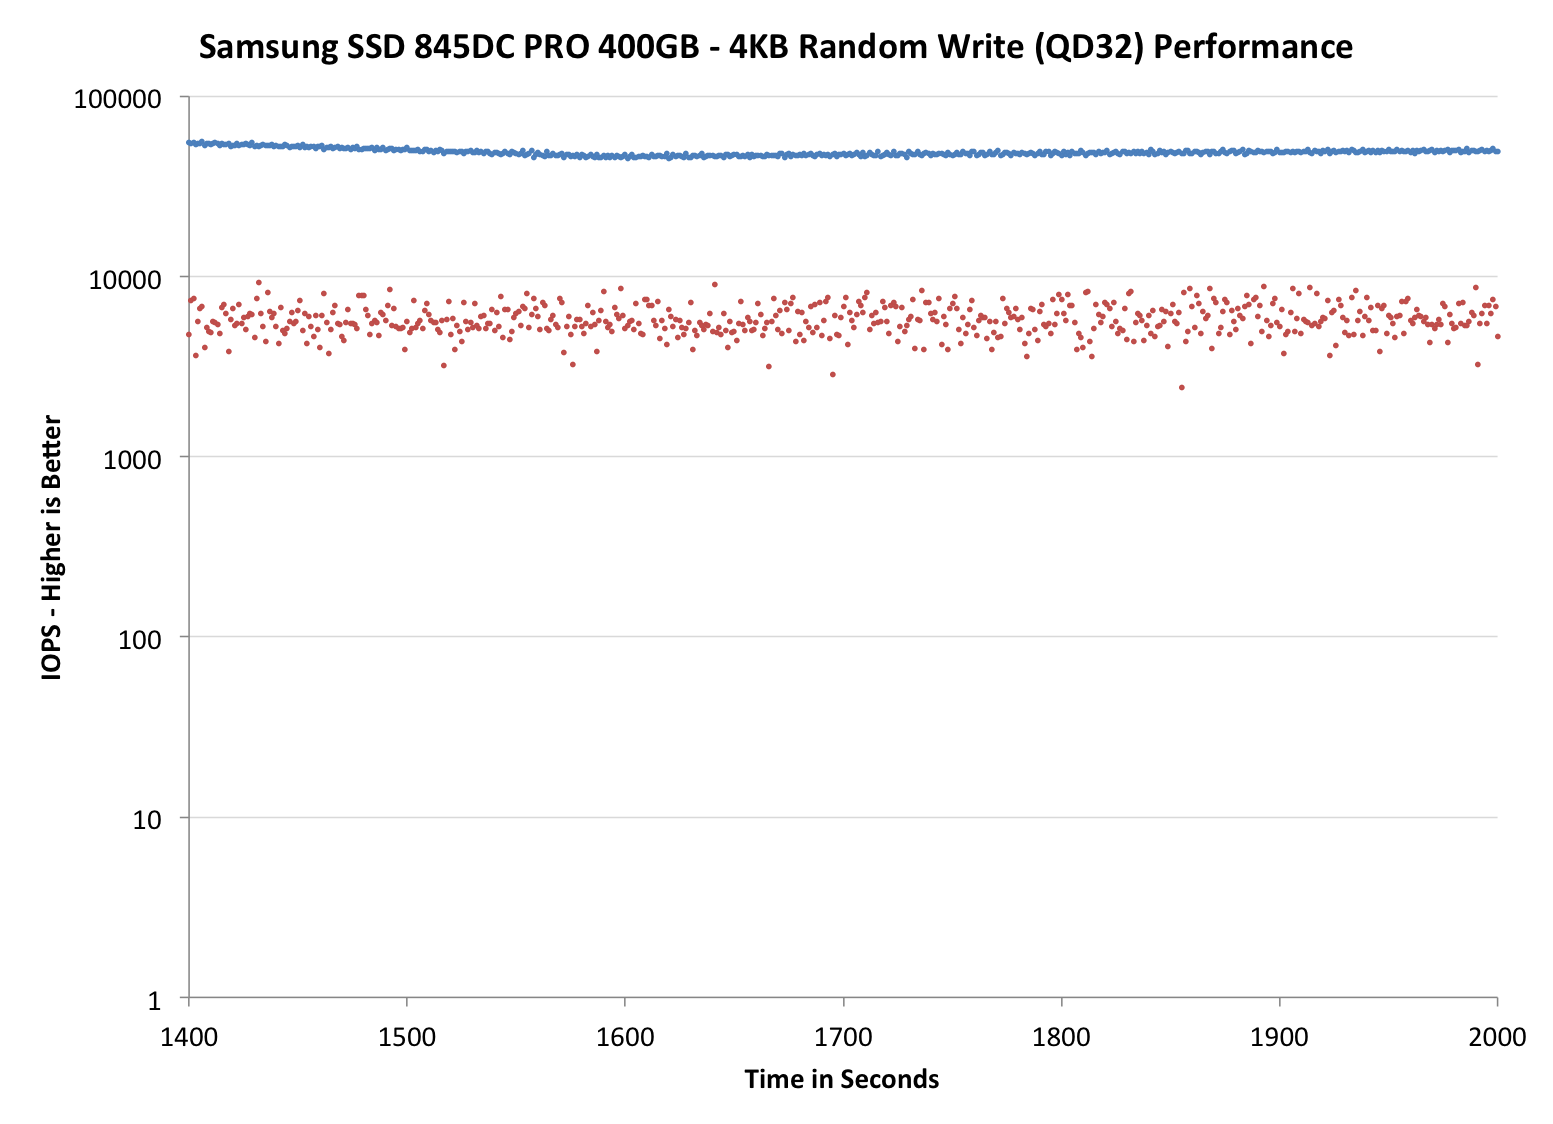
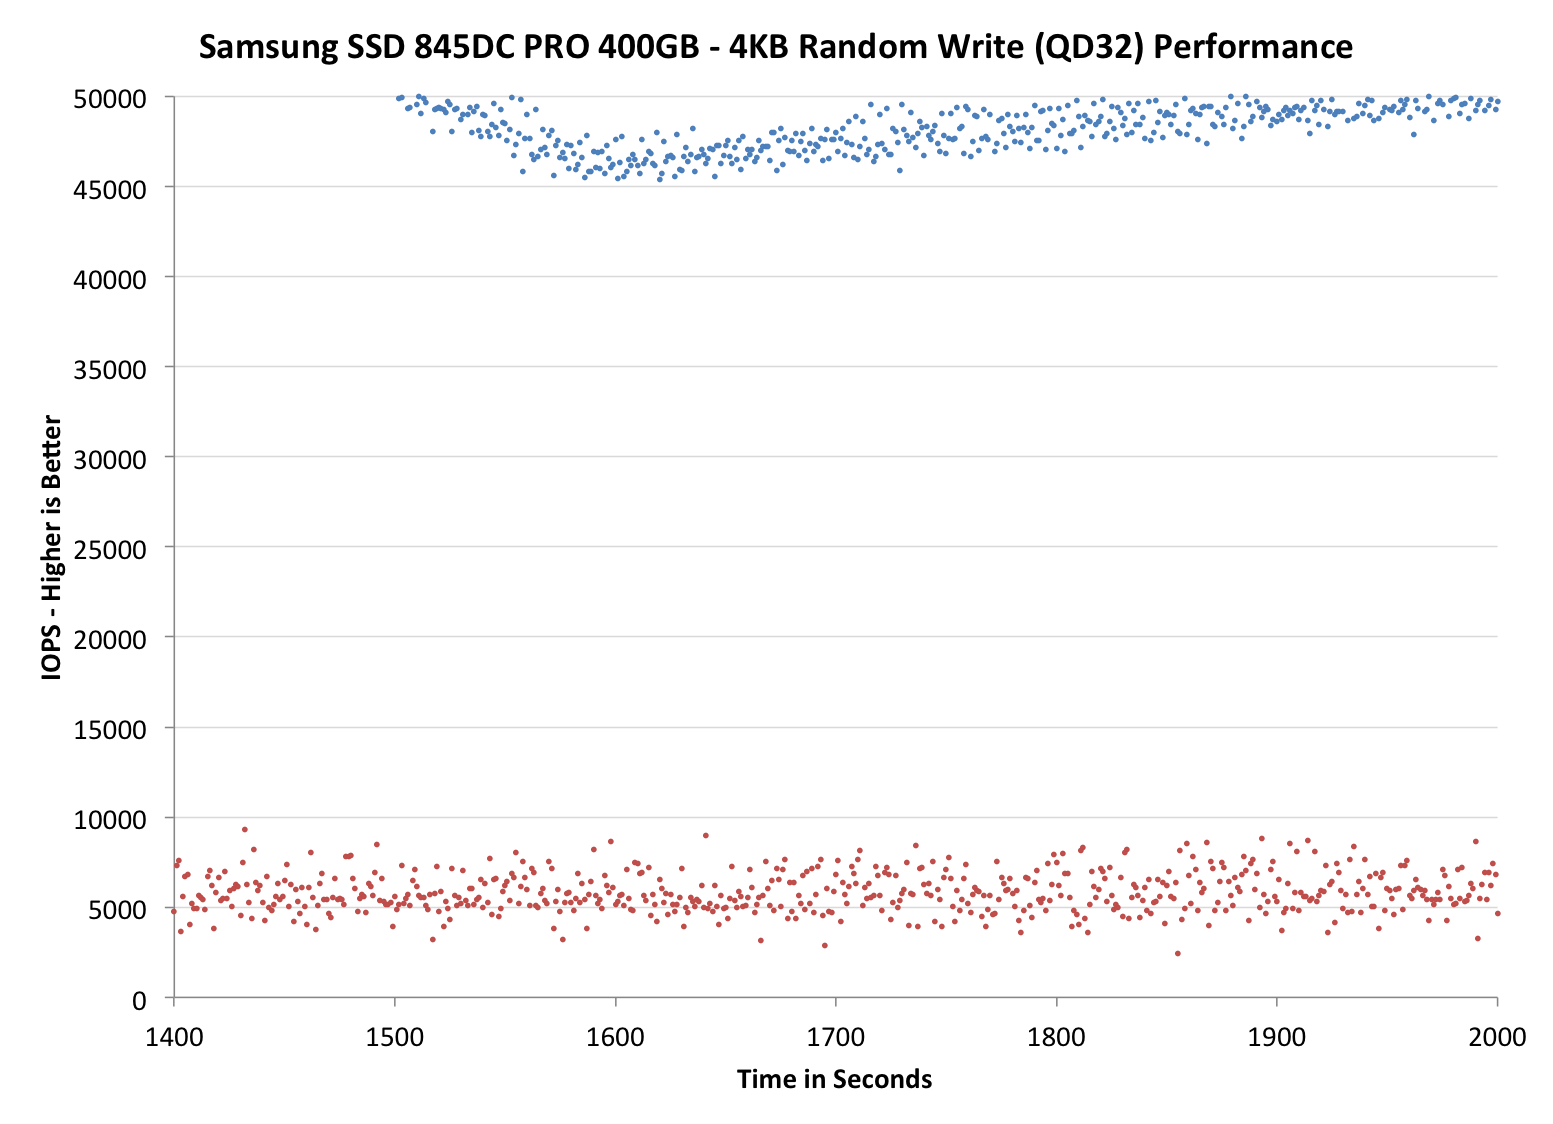
We are now reporting the worst-case IOPS in addition to the average IOPS. The blue dots in the graphs stand for average IOPS just like before, but the red dots show the worst-case IOPS for every second. Since worst-case IOPS is not reported by any benchmark by default, we had to derive it from maximum response time, which is reported by all the major storage benchmarks. Technically reporting the average and maximum latency would be more appropriate because IOPS cannot be calculated based on a single IO (and that is what the maximum latency is), but for the sake of consistency and compatibility with our old graphs we will be using IOPS for the time being. The end result is the same because IOPS is just queue depth over latency, so the graph itself would not be any different aside from the fact that with latency lower scores would be better.
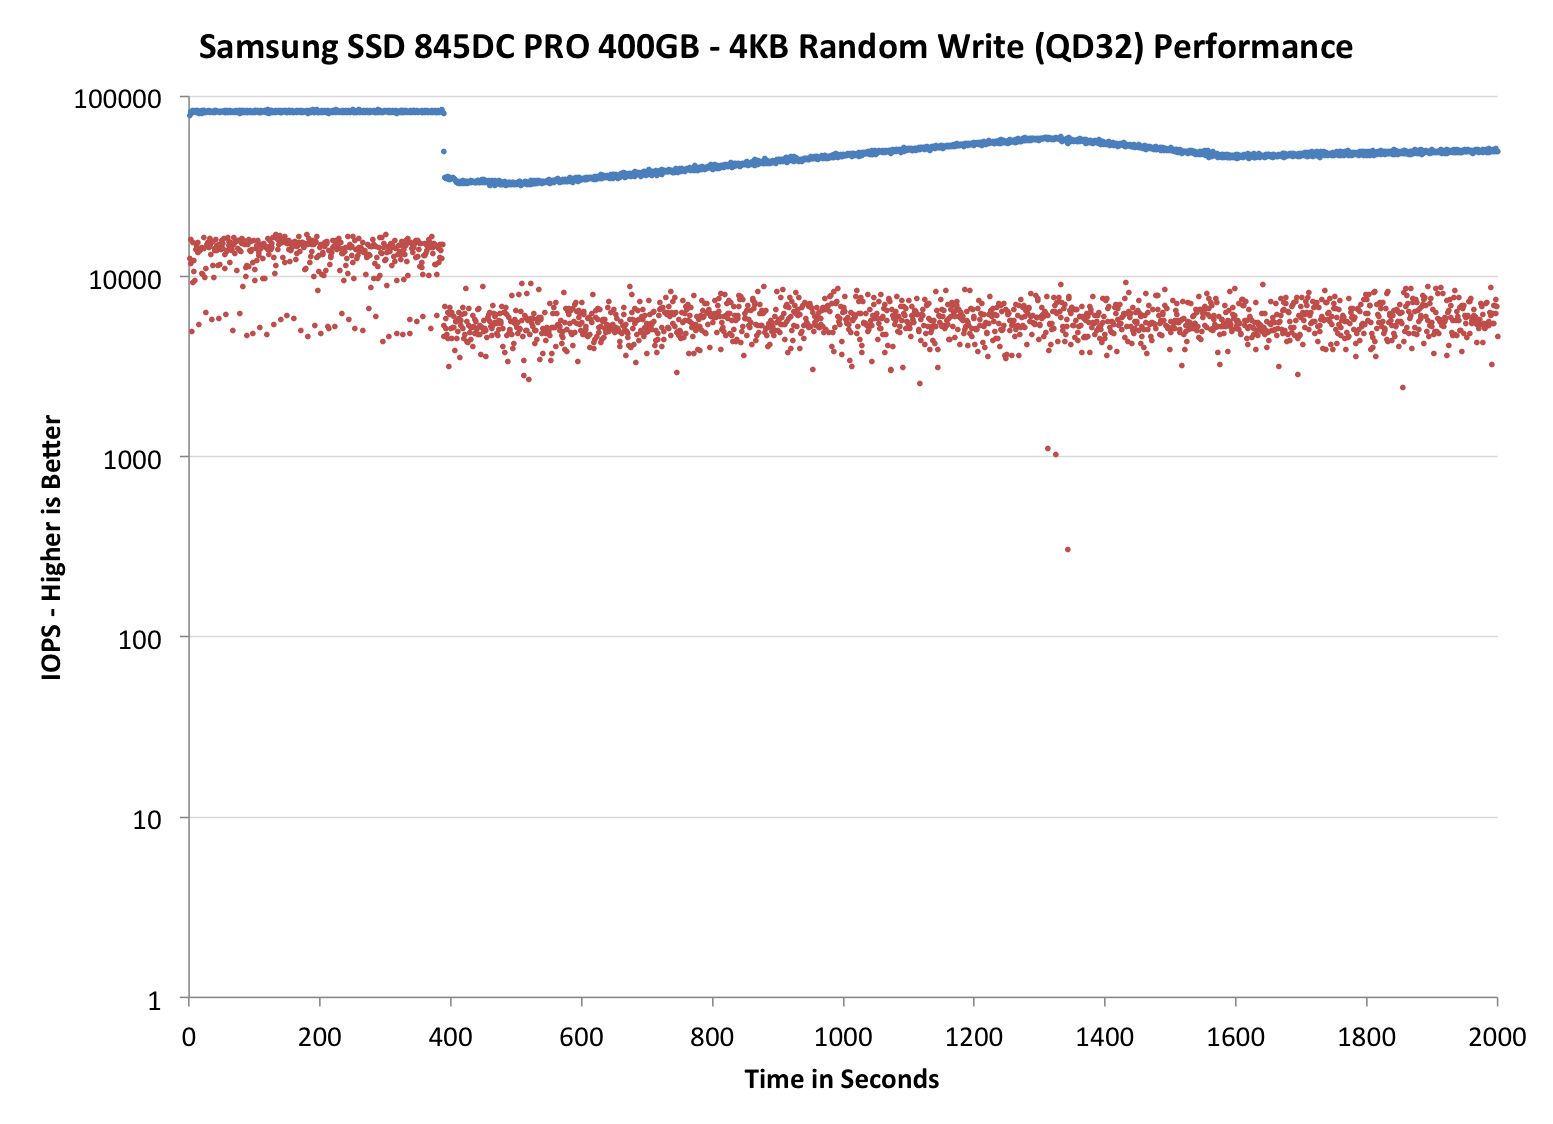
It appears that both the 845DC PRO and EVO have a worst-case IOPS of around 5K, which translates to latency of 6.4ms. Compared to other enterprise SSDs we have tested, that is excellent since for Intel's S3500/S3700, the worst-case IOPS varies between 3K and 5K, and for Micron's M500DC it is about 2K.


31 Comments
View All Comments
Inds - Wednesday, February 4, 2015 - link
Ok, this doesn't clear anything up. If my manufacturer is lying about the IOPS of my SSD, how do I figure out the real value?If they aren't lying about the 97,000 random read IOPS, how many megabytes per second is this for 4KB?
What exactly is the formula? You never elaborate on this in the article beyond senseless ramble.
First of all, how am I gonna know what the queue length even is? The way I see it on benchmark tests, low queue depths have lower MB/s than higher ones so this confuses the hell out of me.
But okay, I wanna know how my 840 Evo will perform random reads in the worst case scenario and QD1 seems to be the worst case scenario according to all the benchmark evidence.
In that case, I must time the QD by the latency. My latency I believe is 1 ms so my result is 1000. 1000 IOPS? Okay, so my 4KB random read speed will be 4 MB/s? That's nowhere close to the real result CrystalDiskMark shows.