Samsung SSD 845DC EVO/PRO Performance Preview & Exploring IOPS Consistency
by Kristian Vättö on September 3, 2014 8:00 AM ESTPerformance Consistency - Worst-Case IOPS
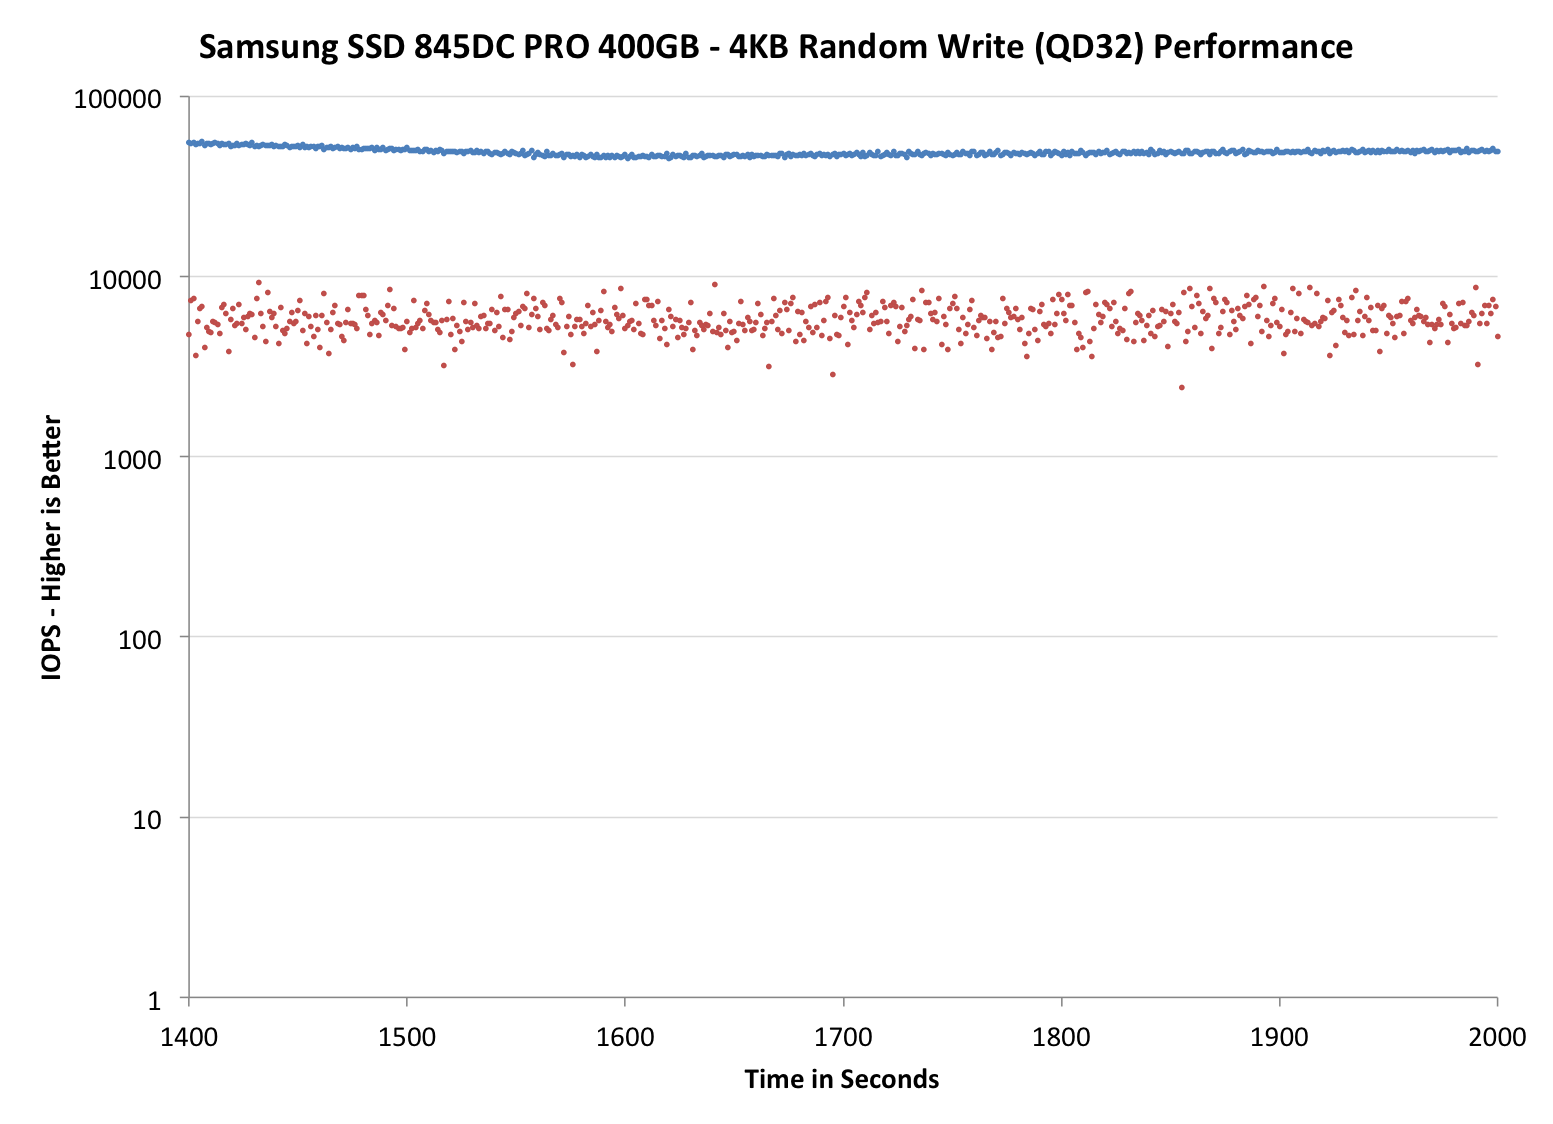
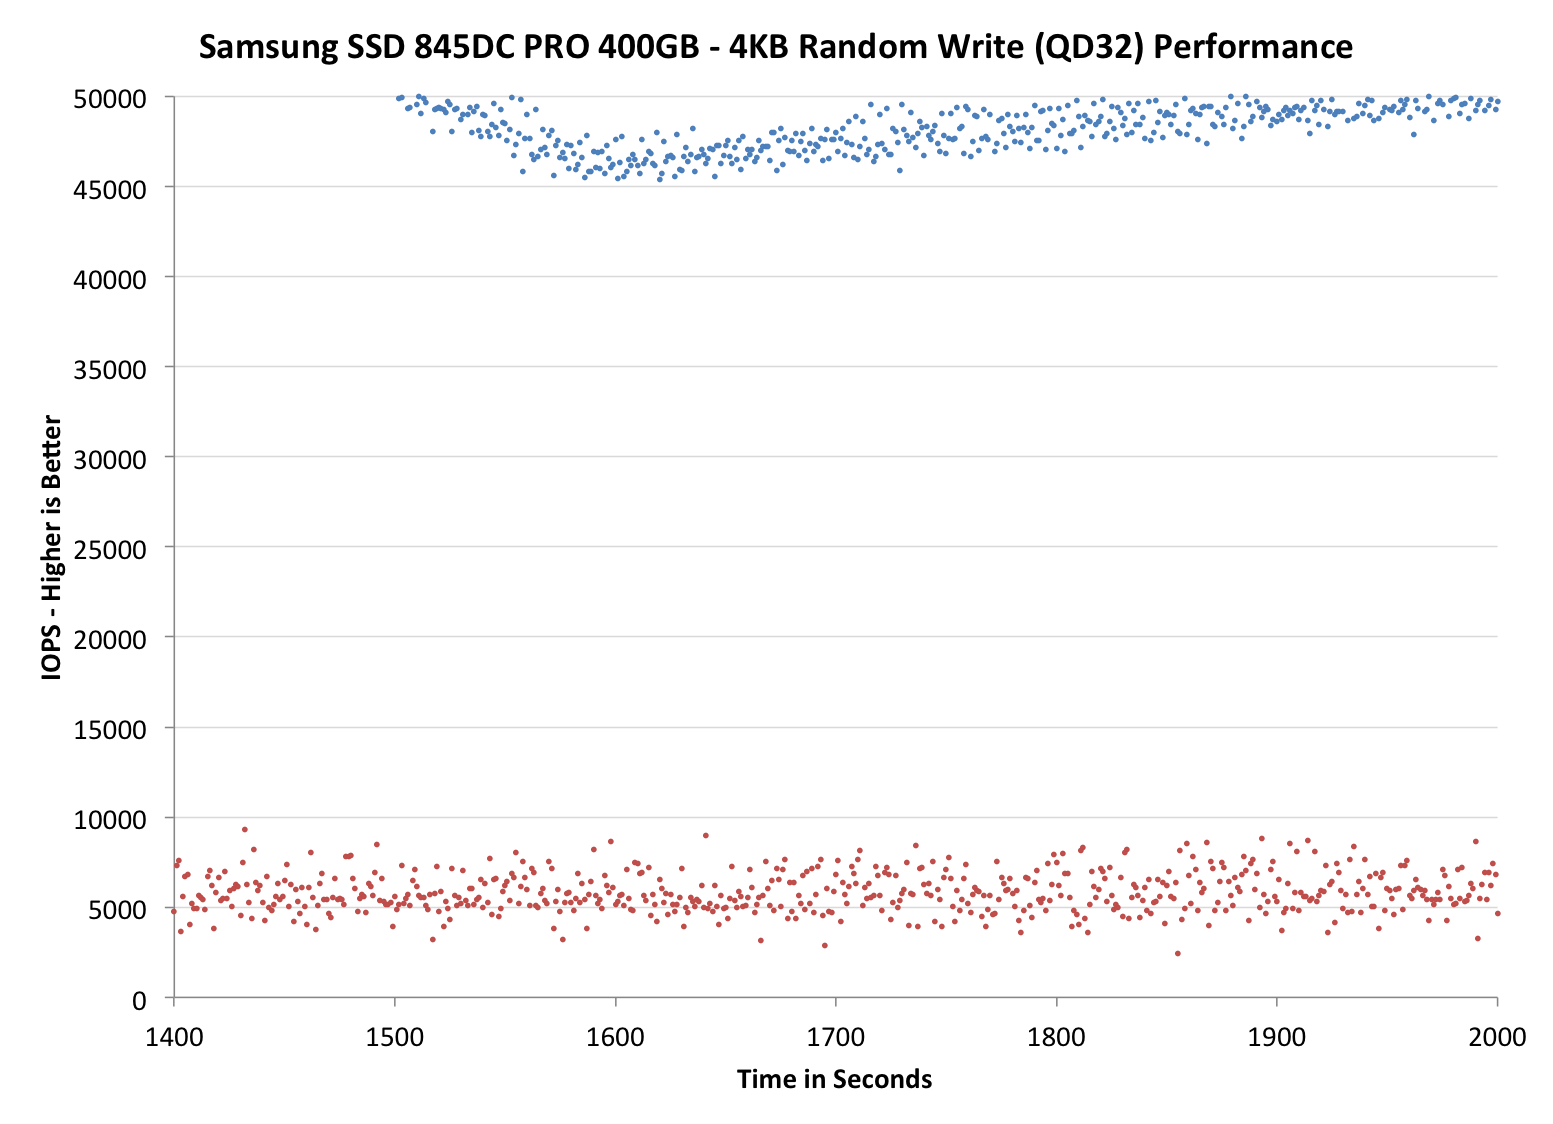
In the past we have only reported average IOPS in one second intervals, which gives us a good picture of overall performance. With modern SSDs, however, there are tens of thousands of IOs happening every second and the fundamental problem with averages is that they do not show how the performance varies and what the worst-case performance is.
Especially in enterprise environments, the worst-case performance can be more salient because the drives operate in an array, which scales the overall performance but also makes worst-case performance drops more significant. For example, if you have a 12-drive array of SSDs that each provide 50K IOPS on average, the theoretical maximum speed of that array would be 600K IOPS. However, if the worst-case performance of each drive is 5K IOPS, the worst-case performance of the array can suddenly drop to 60K IOPS, which can be significant enough to have an impact on user experience.
We are now reporting the worst-case IOPS in addition to the average IOPS. The blue dots in the graphs stand for average IOPS just like before, but the red dots show the worst-case IOPS for every second. Since worst-case IOPS is not reported by any benchmark by default, we had to derive it from maximum response time, which is reported by all the major storage benchmarks. Technically reporting the average and maximum latency would be more appropriate because IOPS cannot be calculated based on a single IO (and that is what the maximum latency is), but for the sake of consistency and compatibility with our old graphs we will be using IOPS for the time being. The end result is the same because IOPS is just queue depth over latency, so the graph itself would not be any different aside from the fact that with latency lower scores would be better.
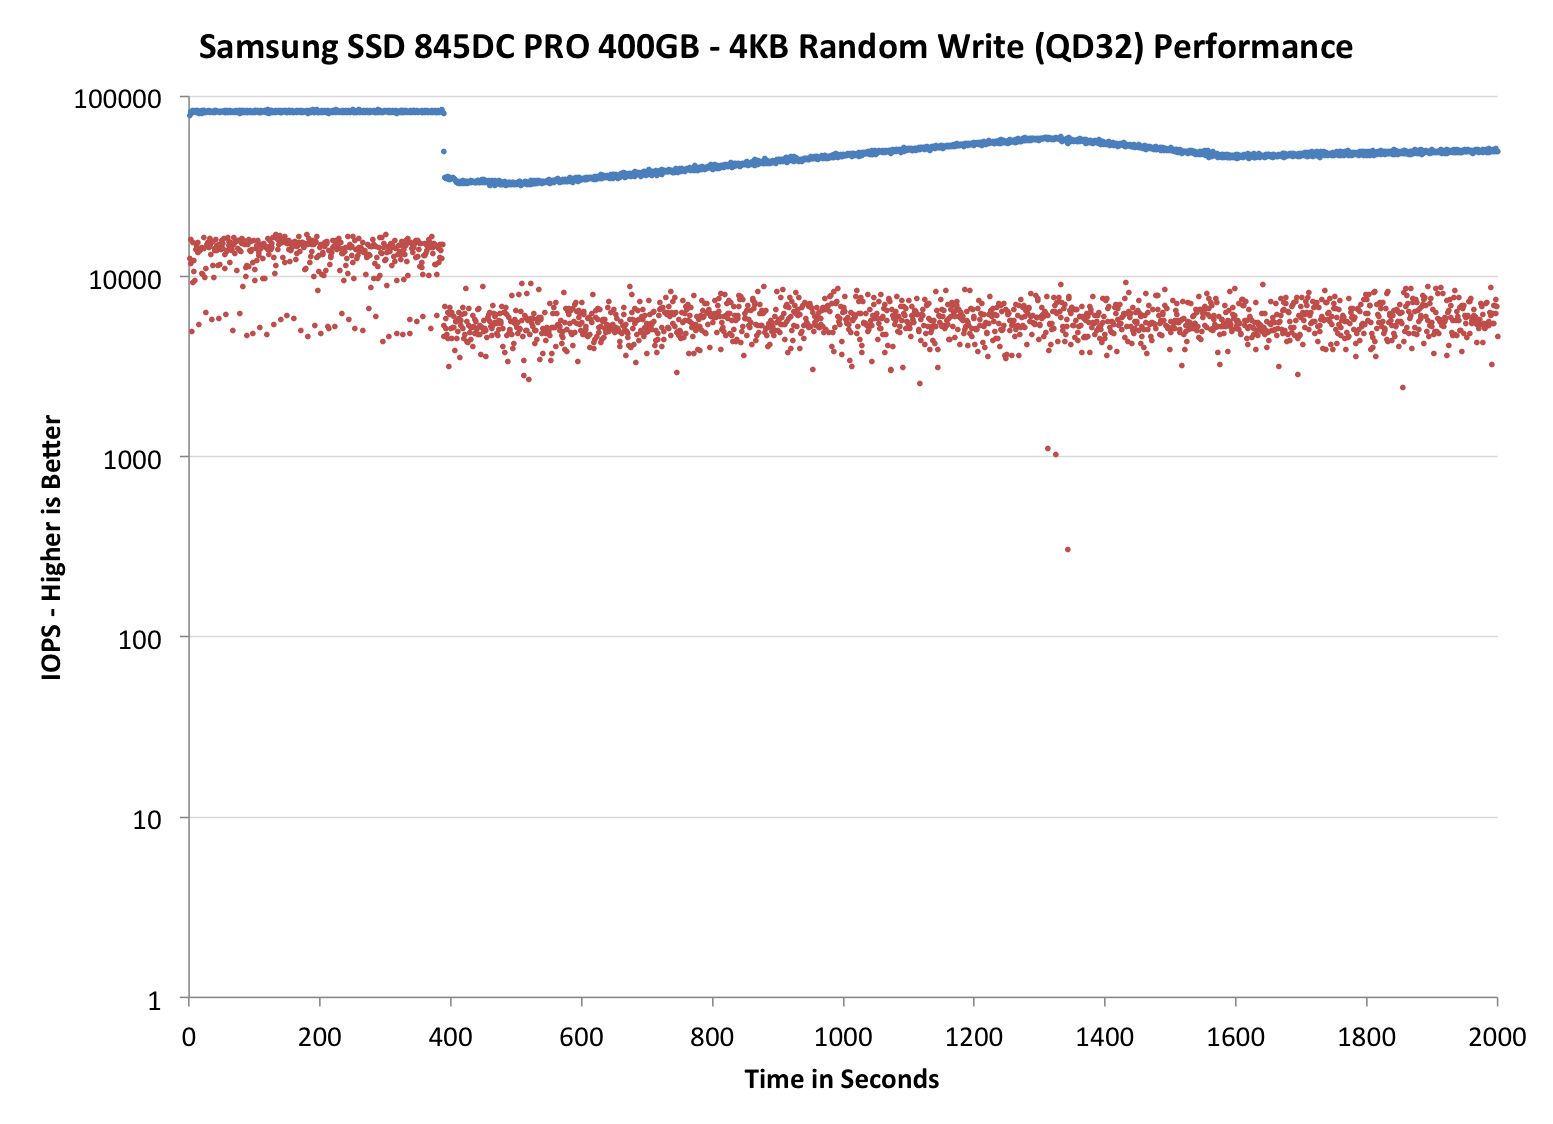
It appears that both the 845DC PRO and EVO have a worst-case IOPS of around 5K, which translates to latency of 6.4ms. Compared to other enterprise SSDs we have tested, that is excellent since for Intel's S3500/S3700, the worst-case IOPS varies between 3K and 5K, and for Micron's M500DC it is about 2K.


31 Comments
View All Comments
Laststop311 - Wednesday, September 3, 2014 - link
Wish the consumer m2 drives would be released already. Samsung sm951 with pcie gen 3.0 x4 controller would be nice to be able to buy.tuxRoller - Wednesday, September 3, 2014 - link
All chart titles are the same on page five (performance consistency average iops).tuxRoller - Wednesday, September 3, 2014 - link
Actually, all the charts carry the same title, but different data.Kristian Vättö - Thursday, September 4, 2014 - link
The titles are basically "name of the SSD and its capacity - 4KB Random Write (QD32) Performance". The name of the SSD should change when you select a different SSD but every graph has the "4KB Random Write (QD32) Performance" attached to it.CountDown_0 - Wednesday, September 3, 2014 - link
Hi Kristian,a small suggestion: when talking about worst case IOPS you write that "The blue dots in the graphs stand for average IOPS just like before, but the red dots show the worst-case IOPS for every second." Ok, but I'd write it in the graph legend instead.
Kristian Vättö - Thursday, September 4, 2014 - link
It's something I thought about and can certainly consider adding it in the future.rossjudson - Thursday, September 4, 2014 - link
I'd suggest the following. Use FIO to do your benchmarking. It supports generating and measuring just about every load you'd care about. You can also use it in a distributed mode, so you can run as many tests as you have hardware to support, at the same time.Second, don't use logarithmic axes on your charts. The drives you describe here take *huge* dropoffs in performance after their caches fill up and they have to start "working for a living". You are masking this performance drop by not using linear measures.
Third, divide up your time axis into (say) 60 second chunks, and show the min/max/95/99/99.9/99.9 latency marks. Most enterprise customers care about sustained performance and worst case performance. A really slow IO is going to hold up a bunch of other stuff. There are two ways out of that: Speculative IO (wait a little while for success then issue another IO to another device), or manage and interleave background tasks (defrag/garbage collect) very carefully in the storage device. Better yet, don't have the problem at all. The marketing stats on these drives have nothing to do with the performance they exhibit when they are subject to non-stop, mixed loads.
Unless you are a vendor that constantly tests precisely those loads, and ensures they work, stay working, and stay tight on latency.
SuperVeloce - Thursday, September 4, 2014 - link
Great review... but dropdown menu for graphs annoys me. ughKristian Vättö - Thursday, September 4, 2014 - link
What do you find annoying in them? I can certainly consider alternative options if you can suggest any.grebic - Thursday, October 2, 2014 - link
Hi Kristian. I need to bother you with a question: do you think isit worth it to stick this SSD in a NAS? I have a ''fanless'' QNAP HS-210, 2 bay small form NAS, without drives for the moment, so in order to have a complete zero noise and time ''resistence'' to go for SSDs. But I was forgoten what was mentioned here "no wear leveling, no garbage collection'', so I'm wondering if in time the performances will decrease dramatically I'm thinking that the OS of NAS is not knowing to do such ''treatments'' over SSDs for maintaining performances, no? It's not in my intention to do operations over operations on NAS but I would like to know that my data will be ''safe'' and easy ''accesible'' over long time, OK? Very appreciated your oppinion. Thanks, Cristian