Samsung SSD 845DC EVO/PRO Performance Preview & Exploring IOPS Consistency
by Kristian Vättö on September 3, 2014 8:00 AM ESTPerformance Consistency - Average IOPS
Performance consistency tells us a lot about the architecture of these SSDs and how they handle internal defragmentation. The reason we do not have consistent IO latency with SSDs is because inevitably all controllers have to do some amount of defragmentation or garbage collection in order to continue operating at high speeds. When and how an SSD decides to run its defrag or cleanup routines directly impacts the user experience as inconsistent performance results in application slowdowns.
To test IO consistency, we fill a secure erased SSD with sequential data to ensure that all user accessible LBAs have data associated with them. Next we kick off a 4KB random write workload across all LBAs at a queue depth of 32 using incompressible data. The test is run for just over half an hour and we record instantaneous IOPS every second.
We are also testing drives with added over-provisioning by limiting the LBA range. This gives us a look into the drive’s behavior with varying levels of empty space, which is frankly a more realistic approach for client workloads.
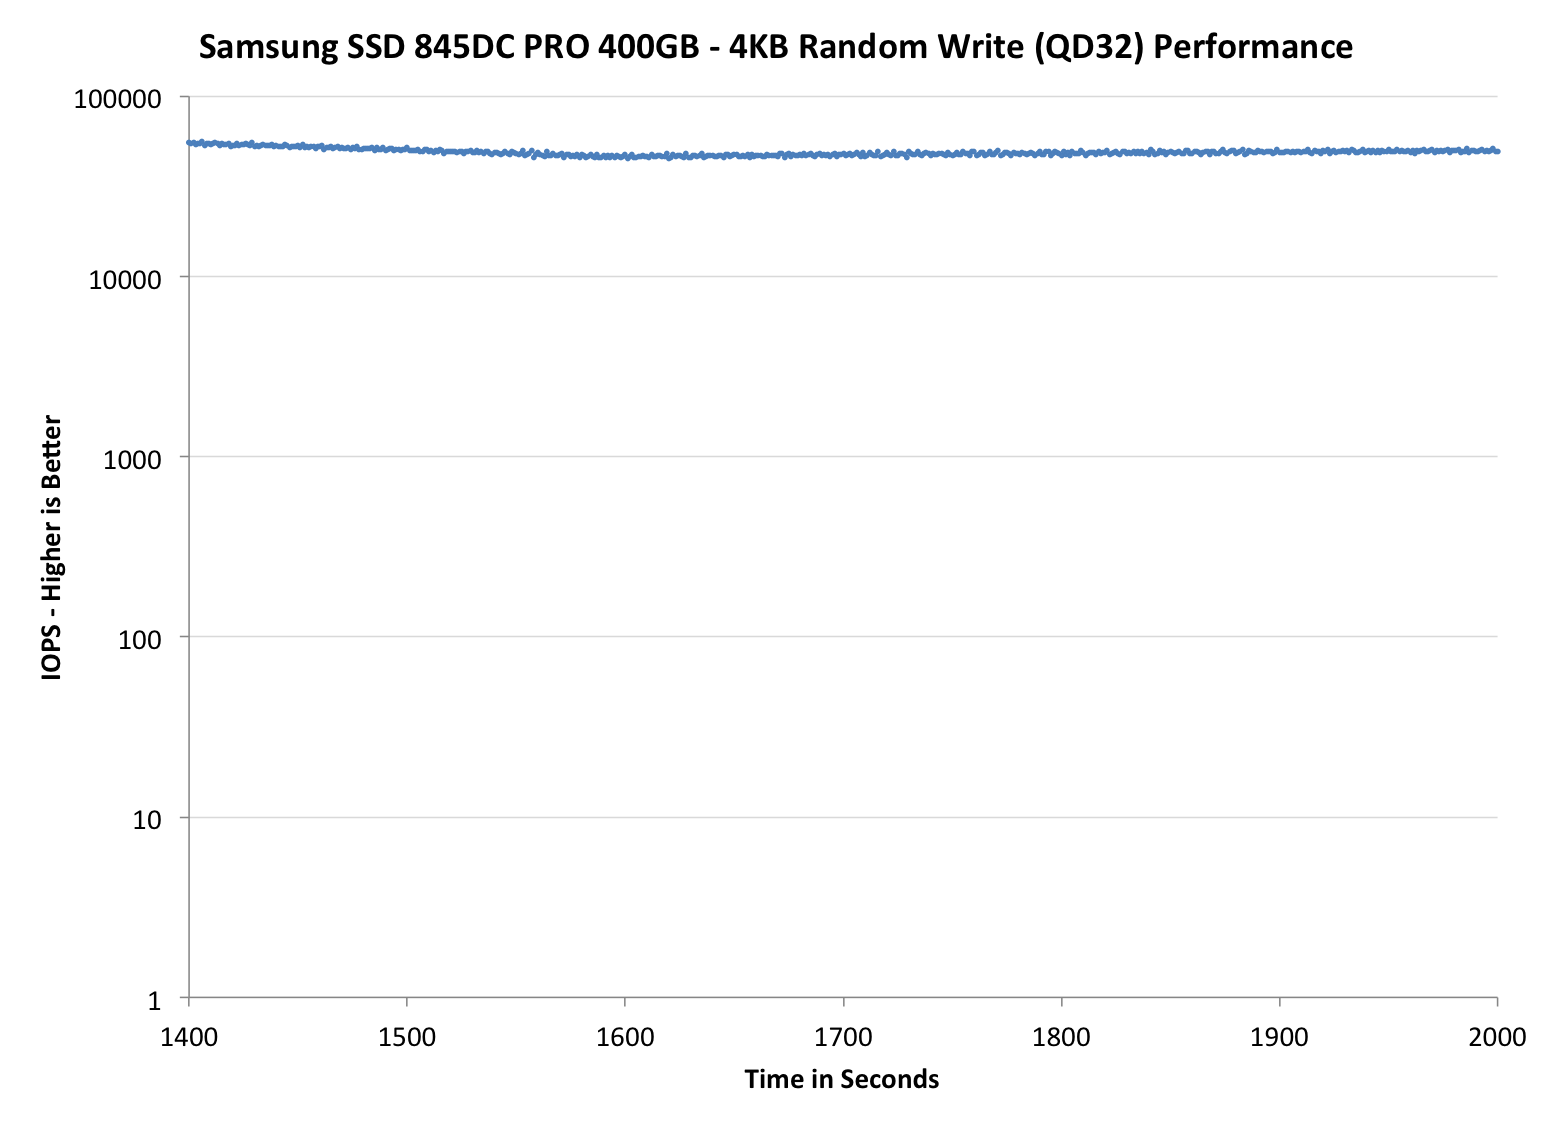
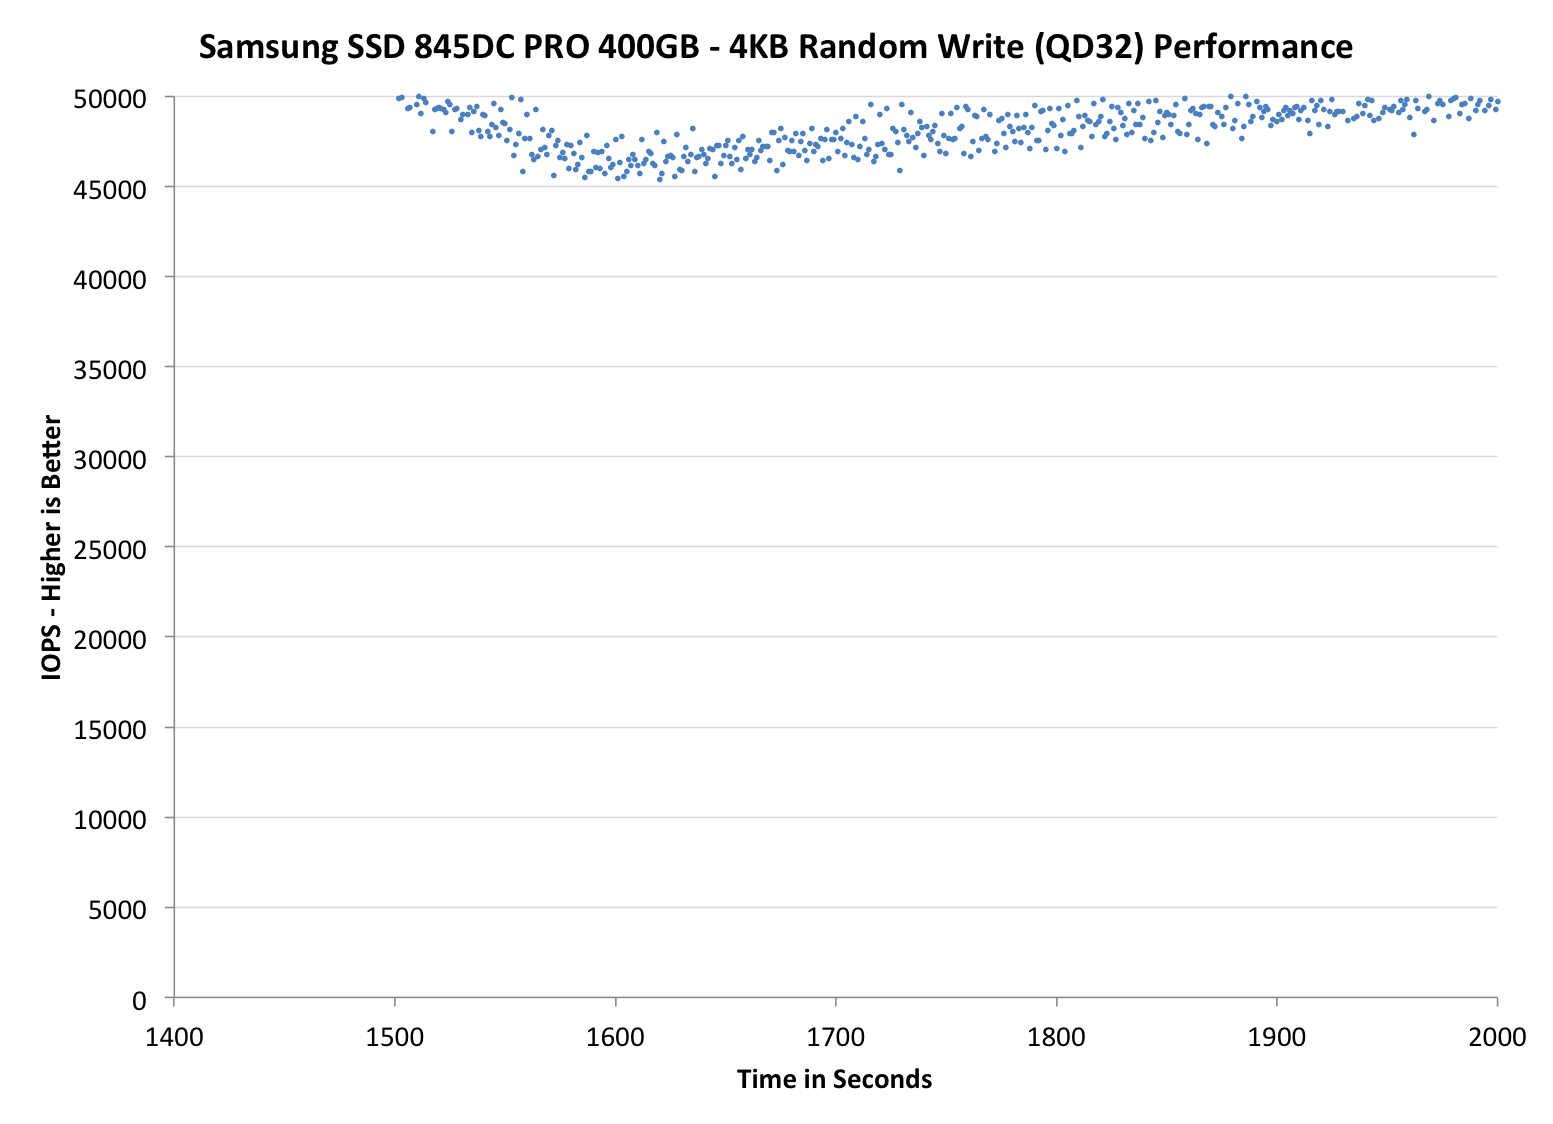
Each of the three graphs has its own purpose. The first one is of the whole duration of the test in log scale. The second and third one zoom into the beginning of steady-state operation (t=1400s) but on different scales: the second one uses log scale for easy comparison whereas the third one uses linear scale for better visualization of differences between drives. Click the dropdown selections below each graph to switch the source data.
For more detailed description of the test and why performance consistency matters, read our original Intel SSD DC S3700 article.
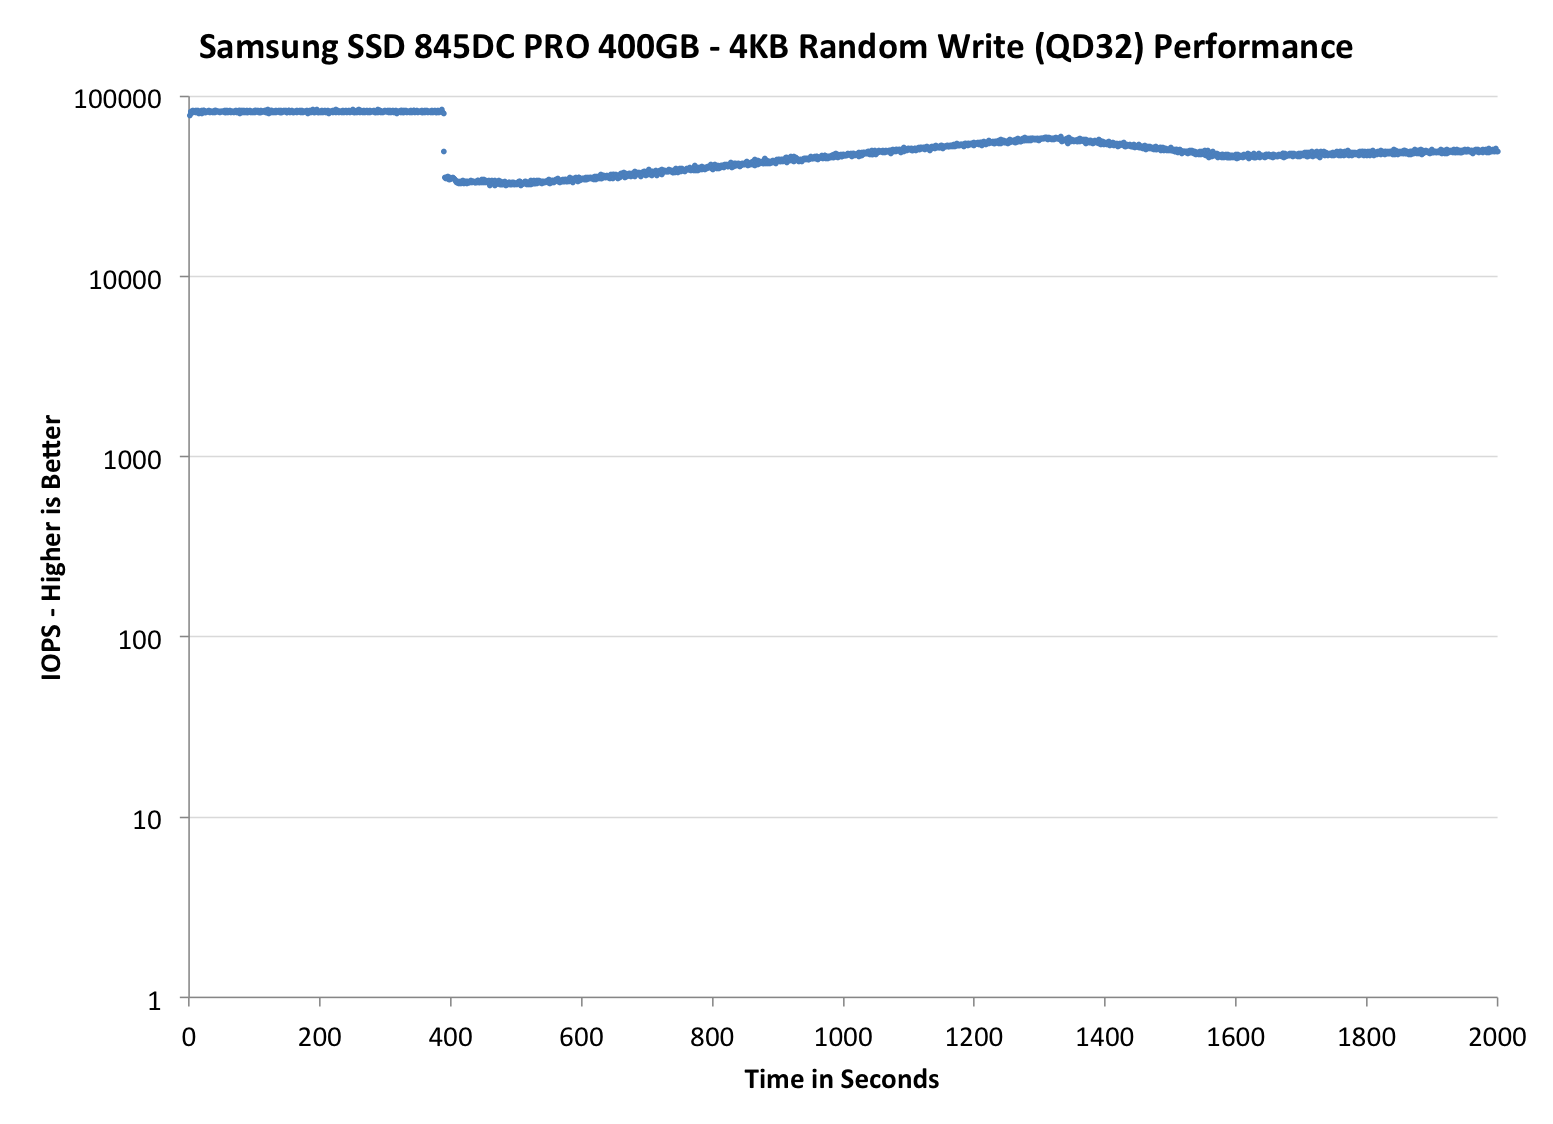
The 845DC PRO is just amazing. While it only has 28% over-provisioning, the 845DC PRO is able to provide 50K IOPS while for instance Intel's SSD DC S3700 is only capable of 35K IOPS, even though both have the same over-provisioning. A part of that can come from the controller and firmware design, but it is obvious that the lower program and erase latencies of V-NAND are behind the performance. It looks like Samsung's heavy investment in 3D NAND technology is really paying off.
The 845DC EVO does very well too despite the slower TLC NAND as it is still able to achieve steady-state performance of ~10K IOPS. The impact of NAND management from higher capacity is evident since the 240GB 845DC EVO performs better than the 960GB version, although I need to run a longer test for the full review to see if the difference evens out.
The PM853T, on the other hand, is a weird case because it is considerably slower than the 845DC EVO. I asked Samsung about this and they told me that there are some differences in garbage collection and wear-leveling algorithms, which causes the performance to be bumpy at first but it should even out after about 3,000 seconds. I will confirm this in the full review.


31 Comments
View All Comments
Laststop311 - Wednesday, September 3, 2014 - link
Wish the consumer m2 drives would be released already. Samsung sm951 with pcie gen 3.0 x4 controller would be nice to be able to buy.tuxRoller - Wednesday, September 3, 2014 - link
All chart titles are the same on page five (performance consistency average iops).tuxRoller - Wednesday, September 3, 2014 - link
Actually, all the charts carry the same title, but different data.Kristian Vättö - Thursday, September 4, 2014 - link
The titles are basically "name of the SSD and its capacity - 4KB Random Write (QD32) Performance". The name of the SSD should change when you select a different SSD but every graph has the "4KB Random Write (QD32) Performance" attached to it.CountDown_0 - Wednesday, September 3, 2014 - link
Hi Kristian,a small suggestion: when talking about worst case IOPS you write that "The blue dots in the graphs stand for average IOPS just like before, but the red dots show the worst-case IOPS for every second." Ok, but I'd write it in the graph legend instead.
Kristian Vättö - Thursday, September 4, 2014 - link
It's something I thought about and can certainly consider adding it in the future.rossjudson - Thursday, September 4, 2014 - link
I'd suggest the following. Use FIO to do your benchmarking. It supports generating and measuring just about every load you'd care about. You can also use it in a distributed mode, so you can run as many tests as you have hardware to support, at the same time.Second, don't use logarithmic axes on your charts. The drives you describe here take *huge* dropoffs in performance after their caches fill up and they have to start "working for a living". You are masking this performance drop by not using linear measures.
Third, divide up your time axis into (say) 60 second chunks, and show the min/max/95/99/99.9/99.9 latency marks. Most enterprise customers care about sustained performance and worst case performance. A really slow IO is going to hold up a bunch of other stuff. There are two ways out of that: Speculative IO (wait a little while for success then issue another IO to another device), or manage and interleave background tasks (defrag/garbage collect) very carefully in the storage device. Better yet, don't have the problem at all. The marketing stats on these drives have nothing to do with the performance they exhibit when they are subject to non-stop, mixed loads.
Unless you are a vendor that constantly tests precisely those loads, and ensures they work, stay working, and stay tight on latency.
SuperVeloce - Thursday, September 4, 2014 - link
Great review... but dropdown menu for graphs annoys me. ughKristian Vättö - Thursday, September 4, 2014 - link
What do you find annoying in them? I can certainly consider alternative options if you can suggest any.grebic - Thursday, October 2, 2014 - link
Hi Kristian. I need to bother you with a question: do you think isit worth it to stick this SSD in a NAS? I have a ''fanless'' QNAP HS-210, 2 bay small form NAS, without drives for the moment, so in order to have a complete zero noise and time ''resistence'' to go for SSDs. But I was forgoten what was mentioned here "no wear leveling, no garbage collection'', so I'm wondering if in time the performances will decrease dramatically I'm thinking that the OS of NAS is not knowing to do such ''treatments'' over SSDs for maintaining performances, no? It's not in my intention to do operations over operations on NAS but I would like to know that my data will be ''safe'' and easy ''accesible'' over long time, OK? Very appreciated your oppinion. Thanks, Cristian