Samsung SSD 850 Pro (128GB, 256GB & 1TB) Review: Enter the 3D Era
by Kristian Vättö on July 1, 2014 10:00 AM ESTAnandTech Storage Bench 2011
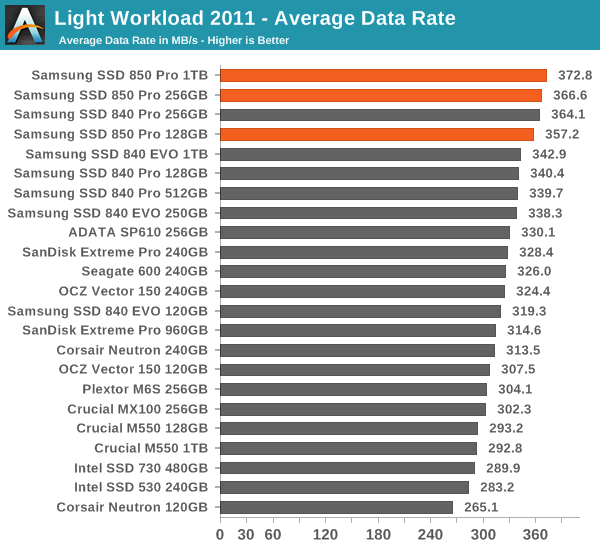
Back in 2011 (which seems like so long ago now!), we introduced our AnandTech Storage Bench, a suite of benchmarks that took traces of real OS/application usage and played them back in a repeatable manner. The MOASB, officially called AnandTech Storage Bench 2011 - Heavy Workload, mainly focuses on peak IO performance and basic garbage collection routines. There is a lot of downloading and application installing that happens during the course of this test. Our thinking was that it's during application installs, file copies, downloading and multitasking with all of this that you can really notice performance differences between drives. The full description of the Heavy test can be found here, while the Light workload details are here.
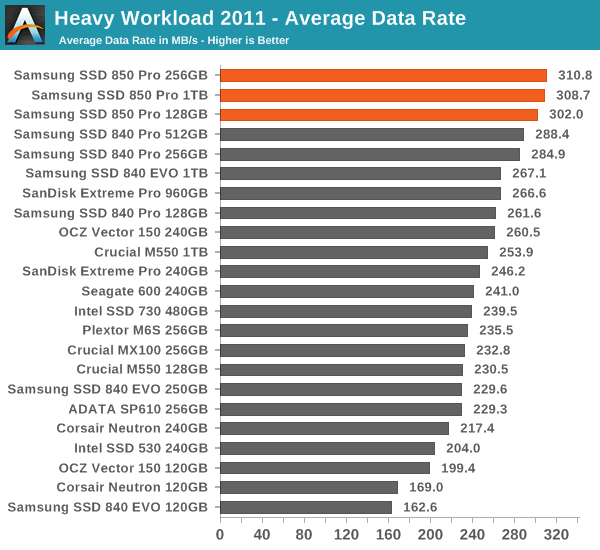
The dominance continues in our 2011 Storage Benches. The 840 Pro was already the fastest drive in both suites, so it does not come as a surprise that the 850 Pro takes the lead.


160 Comments
View All Comments
Cerb - Tuesday, July 1, 2014 - link
The SSD just quitting could brick the drive, and could hose up the FS. Like ECC RAM, if you need power loss protection, you need it regardless of file system. IMO, they should all at least be equipped with enough to gracefully finish in-progress writes and shut down (not necessarily empty buffers, but set up a state that they can be guaranteed to be able to roll back from).sonicology - Tuesday, July 1, 2014 - link
Typo?"Scaling below 20nm was seemed as a major obstacle but the industry was able to cross that..."
seemed a major obstacle or seen as a major obstacle, but not seemed as a major obstacle
Bladen - Tuesday, July 1, 2014 - link
Is it just me, or does the "Performance Consistency" page have interactive charts, all of which are entitled "(SSD name and capacity) - 4KB Random Write (QD32) Performance", but with different results in each of the graphs for the same SSDs and capacities? Also, descriptive text is missing below the last two.I'm presuming they are supposed to be a read and another read or write one, presumably at a lower queue depth.
MrSpadge - Tuesday, July 1, 2014 - link
They're the same data in different scales.paesan - Tuesday, July 1, 2014 - link
I purchased a 512GB MX100 when they first came out for $199. No way the extra speed from the 850 pro is worth over twice the price as the MX100. Nobody is going to keep that drive for 10 years anyway. In 10 years the drive will be obsolete. Most users won't even notice the difference in speed in their every day usage.MrSpadge - Tuesday, July 1, 2014 - link
BTW: that image is surely not an X-Ray but "just" an ordinary SEM image (scanning electron microscope).Spatty - Tuesday, July 1, 2014 - link
This is correct. SEM image after a FIB.drwho9437 - Wednesday, July 2, 2014 - link
As I mentioned elsewhere, it is probably a STEM bright field image after a FIB liftout of the gate stack. Certainly not an X-ray; he should be correct the article...Cerb - Tuesday, July 1, 2014 - link
"The wear out causes the insulators to lose their insulating characters" - shouldn't that be characteristic(s)?jann5s - Tuesday, July 1, 2014 - link
I'm wondering If this technology will also end up in SD (XD) memory cards?