The Intel Haswell Refresh Review: Core i7-4790, i5-4690 and i3-4360 Tested
by Ian Cutress on May 11, 2014 3:01 AM ESTSynthetic IGP Benchmarks
OpenCL – CompuBench: link
CompuBench is an OpenCL and RenderScript benchmark designed by Kishonti for both CPUs and any GPGPU capable device. While it offers almost two dozen tests, we select the more real-world tests in terms of fluid simulation and image analysis benchmarks and test on the CPU and IGP respectively. The CPU results are earlier in the review, and the IGP results are below.
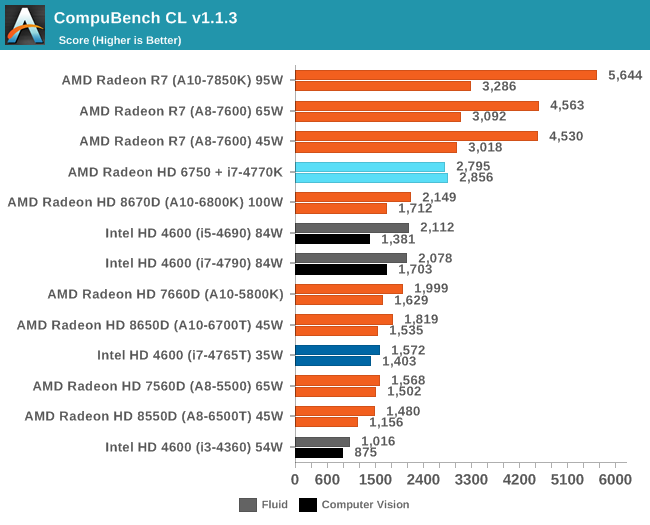
CompuBench responds well to actual cores, but not so much to threads, given by the close scores of the i5 and i7 CPUs. AMD still wins here.
Unity – Graphic Scene 720p: link
As part of my IGP testing I went searching for a couple of new Unity based benchmarks to help decipher the line between the desktop graphics solutions and those that are not so great. First up is a graphical humdinger, implementing a complex scene with lighting effects (including fluid simulation, shadows, SSAO, Bloom). We run the benchmark at 720p with the highest graphical settings, reporting the average FPS.
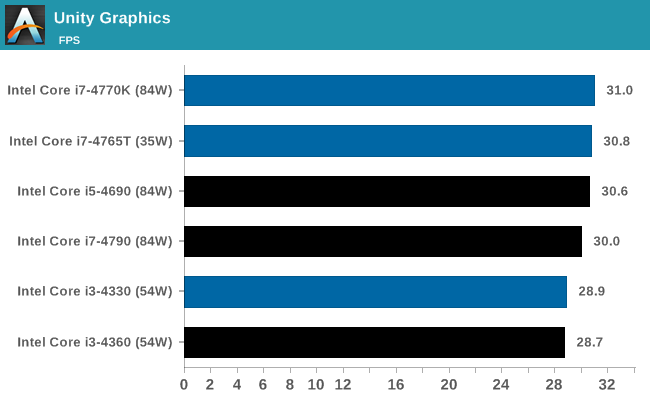
The HD 4600 seems relatively CPU agnostic for complex graphics in Unity. More GPU power seems needed.
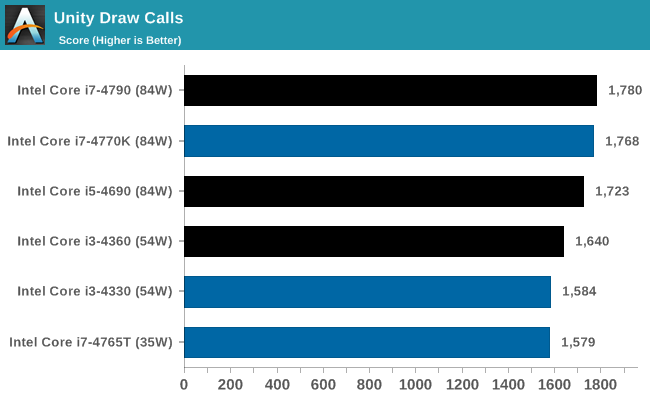
Unity – Draw Calls: link
Next up is a benchmark limited by draw calls rather than rendering complexity. The scene generates simple Nintendo Gamecube polygons that fall due to gravity and bounce around until stationary. The scene continuously spews out these polygons until three consecutive frames fall under a 20 FPS average. We run the benchmark at 720p at simple graphic settings to minimize the graphical complexity, take the number of consoles that spawn from each run and average over several runs.
3DMark
The synthetic tools from Futuremark have been on the benchmarking landscape for over a decade, with each generation designed to tackle new problems as either the CPUs or GPUs become too powerful. Here we test 3DMark 06, 3DMark 11 (Performance) and the latest 3DMark.
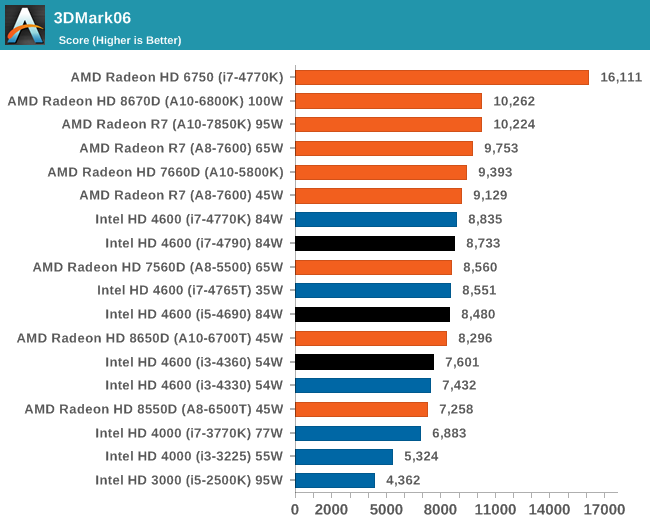
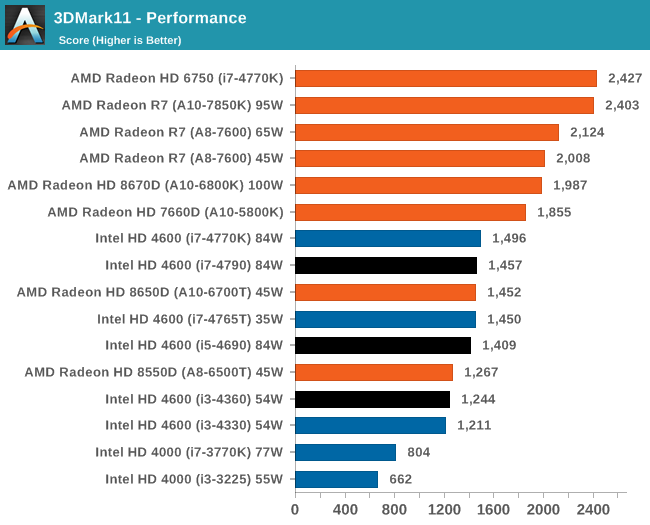
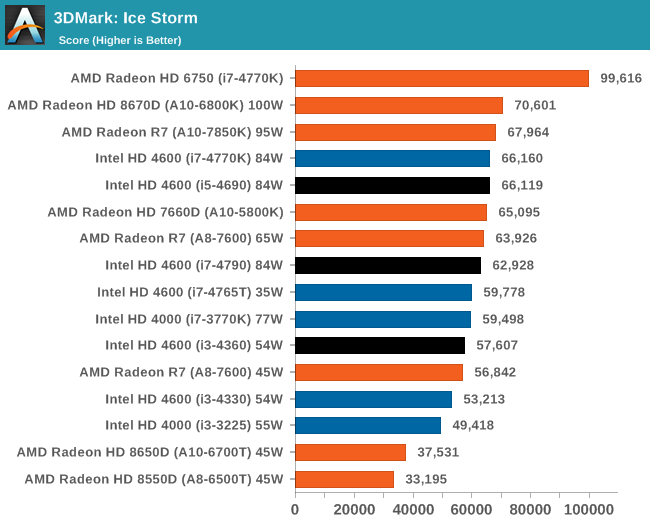
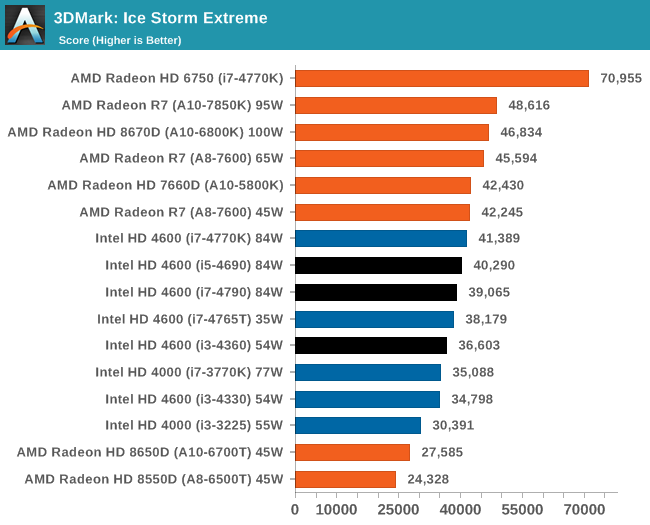
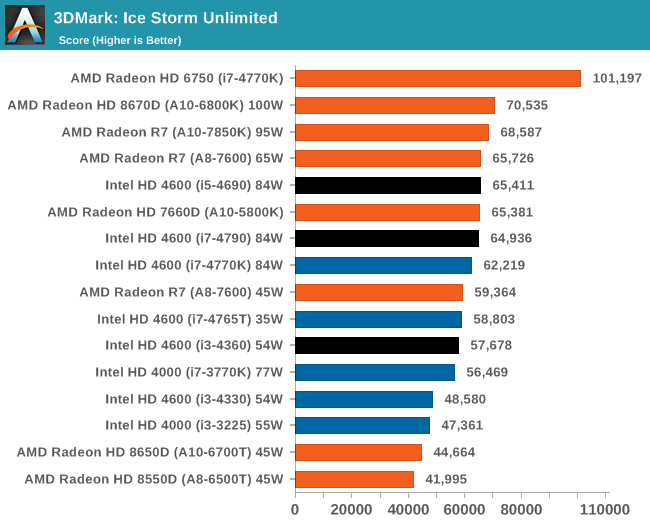
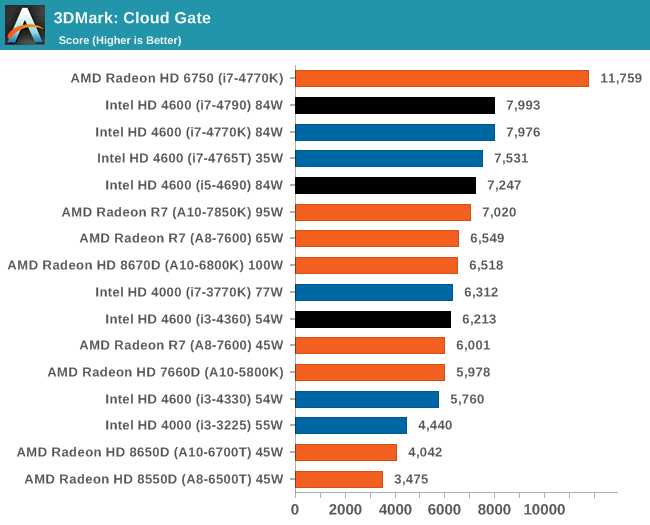
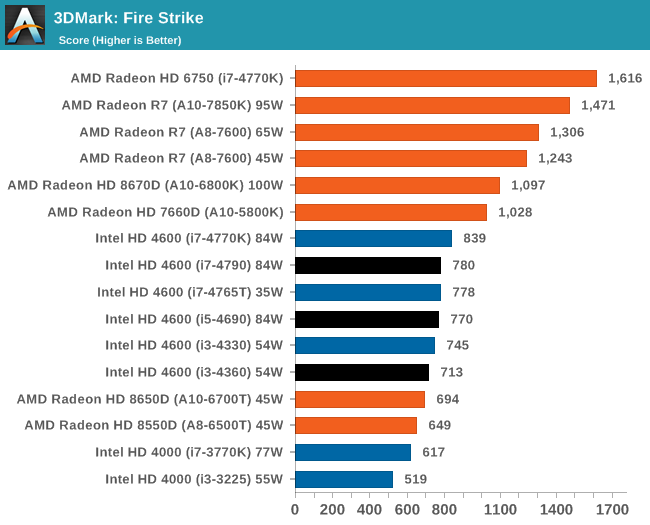
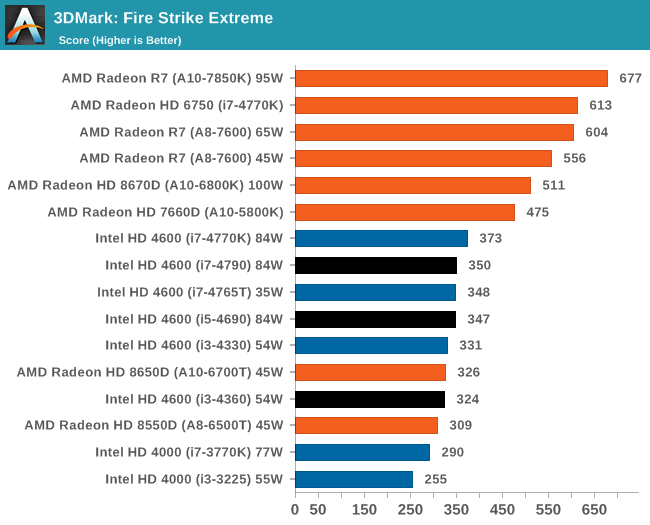
For CPU limited testing, such as Cloud Gate, the Intel i7 pulls ahead with the i5 quickly in tow. For the others, AMD has the lead.
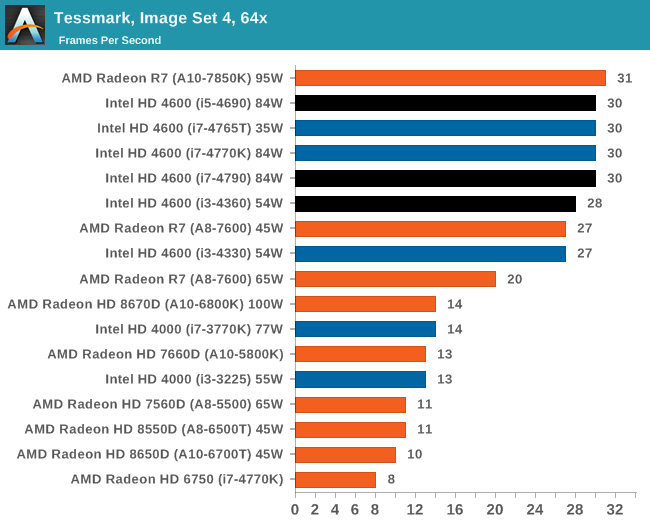
Tessmark
The latest version of TessMark is designed to focus on tessellation via OpenGL 4. We run the latest version of the benchmark using the high resolution map set at maximum tessellation while 1080p full screen, reporting the average FPS.


130 Comments
View All Comments
rajod1 - Thursday, May 29, 2014 - link
I agree, waste of cash to upgrade every generation. Old days were nice. Intel said they would hit 10 GHZ by like 2004 or something. LOL. So they hit a wall but still needed cash. Lots of suckers born every minute that will upgrade for 10 percent increase.Hrel - Monday, May 12, 2014 - link
The fact that hyperthreading is disabled on the i5's on the desktop is infuriating. Enabling it costs them nothing. Agree on the 8 core at $300, it should still have HT though.Flunk - Monday, May 12, 2014 - link
Definitely, turn on HT on i5 and give them all 4 cores and offer an 8 core i7 with HT. i3s can soldier on with only 2 cores if they really want to.A i7 5770 with 8 cores and HT is what they really need to bring out, but I think they're waiting for AMD to bring out something better first.
rajod1 - Friday, May 30, 2014 - link
You may as well ask them to drop the I5 because if you put HT on a I5 its then I7.rajod1 - Friday, May 30, 2014 - link
It does cost them something. They sell my I7s that way.bsim500 - Sunday, May 11, 2014 - link
Thanks for this review - appreciate the effort that went into it as always."Also of note is the Z97 motherboard we used for these tests implements an Adaptive voltage profile, meaning that artificial loads such as OCCT push the voltage higher than normal, increasing power consumption at load"
So they've still got that dumb Haswell "feature" of stuffing the Vcore up by +0.1v when you least want it? Also why are your power consumption figures so high in general? My i5-3570 @ 4.0Ghz barely pulls 37w idle / 88w 4-threads prime with a 7870 discrete card (whole system (excluding monitor) measured at the wall). That's roughly 25w lower both idle & load than your i3 (with a 1600MHz idle vs 800Mhz Haswell's)! Just out of curiosity, what where the stock / default VID's like on the i3-4360 / i5-4690? ie, has the clock speed bump increased required voltages much? Thanks.
Ian Cutress - Sunday, May 11, 2014 - link
Adaptive is an Intel specification implementation, but for some reason goes haywire with certain 100% load simulators (OCCT/AIDA).With regards power consumption seeming high:
a) Low efficiency band of the PSU. Hence me stating qualitative analysis more relevant than quantitative. Need to keep the PSU consistent across all the tests, some tests require 2x/3x GPUs (e.g. X79). This is probably a large part of it, but all tests are therefore done on the same efficiency curve.
b) Using a Corsair H80i with two fans and ODD plugged in. I move the USB devices to USB 2.0 so any USB 3.0 controller can power down, but it still all adds up.
c) OCCT loading does the adaptive voltage thing, causing more power consumption at load from idle.
We got ES chips to test, so retail might have adjusted slightly on the stock VID. Also VID can differ from chip to chip in the same bin, so it's not really a good measure. One CPU can have a high VID in the bin, while the next bin up we could get a low VID, and it all look a bit odd.
Daniel Egger - Sunday, May 11, 2014 - link
IMNSHO it is really ridiculous to test all systems with the same outlandish special PSUs that no sane person would ever use. Why not have a testbed for single card systems with say a platinum 500W PSU (which should cover even the nasty R295X2 plus a Haswell K processor) and a separate one for crazy setups? With those far sub 20% loads even under full load it is nearly impossible to get useful readings not to mention comparable ones since at these low loads lots of funny effects kick in skewing the results...wetwareinterface - Sunday, May 11, 2014 - link
The reason you don't have a low end psu on your test bench is it's a test bench.The one setup should handle anything you can possibly throw at it and then a little extra for good measure.
Also having the exact same high wattage psu to test everything on eliminates the psu as a differentiating factor when testing multiple system configurations.
and finally the sad truth is there are several reviewers working for anandtech each from home and each with whatever they have laying around to do said testing with...
Daniel Egger - Monday, May 12, 2014 - link
> The reason you don't have a low end psu on your test bench is it's a test bench.The one setup should handle anything you can possibly throw at it and then a little extra for good measure.
Exactly my point for suggesting a 500W PSU rather than something much lower that I would personally put into a build. That should be sufficient for any even just halfway reasonable setup.
> Also having the exact same high wattage psu to test everything on eliminates the psu as a differentiating factor when testing multiple system configurations.
Unfortunately that's not true. Very low output on high wattage PSUs skews the results quite a bit because they typically are not accurate enough when it comes to handling the low loads thus smearing over the results with their own losses. I assume this is also why our Greek friend here doesn't even bother to test loads below 5% (which would be 60W at a 1200W PSU, about twice as much as my current Haswell PC needs on an mostly Idle Windows desktop).