AMD Kaveri Review: A8-7600 and A10-7850K Tested
by Ian Cutress & Rahul Garg on January 14, 2014 8:00 AM ESTTesting Platform
For our Kaveri testing AMD sent us two APUs – the top 95W A10-7850K SKU and the configurable TDP version of the A8-7600 APU, the latter of which can be set at 45W or 65W through the BIOS. The A8-7600 was tested in both power configurations, ultimately the difference between them both being only a few hundred MHz. The 65W configuration is only 200 MHz off the A10-7700K base frequency, and incidentally they both turbo to the same frequency of 3.8GHz.
Kaveri will be the first APU put through the mangle in terms of my new 2014 benchmarking suite, focusing on more compute tasks, video conversion in different software, and more real world scenarios geared for the prosumer.
We must thank the following companies for their contribution to the test beds:
- Many thanks to AMD for supporting us with their APUs, AMD Radeon Memory and test system
- Many thanks to ASRock for supporting us with their FM2A88X Extreme6+ and FM2A88X-ITX+ motherboards and the loan of APUs
- Many thanks to G.Skill for supporting us with their RipjawsX and RipjawsZ memory kits
- Many thanks to OCZ for supporting us with their 1250W Power Supplies and Vertex SSDs
- Many thanks to Samsung for supporting us and AMD with their 840 EVO SSD
- Many thanks to Antec for supporting us and AMD with their 750W High Current Pro PSU
- Many thanks to Xigmatek for supporting us and AMD with their Nebula SFF chassis
Our test setup for AMD is as follows:
| AMD APU TestBed | ||||||||
| SKU | Cores |
CPU / Turbo |
DRAM MHz |
Power | IGP | SPs |
GPU MHz |
|
| Kaveri APUs | A10-7850K | 2M/4T |
3.7 GHz 4.0 GHz |
2133 | 95W | R7 | 512 | 720 MHz |
| A8-7600 | 2M/4T |
3.3 GHz 3.8 GHz |
2133 | 65W | R7 | 384 | 720 MHz | |
| A8-7600 | 2M/4T |
3.1 GHz 3.3 GHz |
2133 | 45W | R7 | 384 | 720 MHz | |
| Richland APUs | A10-6800K | 2M/4T |
4.1 GHz 4.4 GHz |
2133 | 100W | 8670D | 384 | 844 MHz |
| A10-6700T | 2M/4T |
2.5 GHz 3.5 GHz |
1866 | 45W | 8650D | 384 | 720 MHz | |
| A8-6500T | 2M/4T |
2.1 GHz 3.1 GHz |
1866 | 45W | 8550D | 256 | 720 MHz | |
| Trinity APUs | A10-5800K | 2M/4T |
3.8 GHz 4.2 GHz |
2133 | 100W | 7660D | 384 | 800 MHz |
| A8-5500 | 2M/4T |
3.2 GHz 3.7 GHz |
1866 | 65W | 7560D | 256 | 760 MHz | |
| Memory |
AMD Radeon 2 x 8 GB DDR3-2133 10-11-11 1.65V G.Skill RipjawsX 4 x 4 GB DDR3-2133 9-11-11 1.65V G.Skill RipjawsZ 4 x 4 GB DDR3-1866 8-9-9 1.65V |
|||||||
| Motherboards |
ASRock FM2A88X Extreme6+ ASRock FM2A88X-ITX+ |
|||||||
| Power Supply | OCZ 1250W ZX Series | |||||||
| Storage | OCZ 256GB Vertex 3 SSDs | |||||||
| Operating System | Windows 7 64-bit SP1 with Core Parking updates | |||||||
| Video Drivers |
Graphics Driver Build 13.300 RC2 for Radeon R7 Catalyst 13.12 for all others |
|||||||
Unfortunately we were not able to source a 65W Richland part in time, however a midrange 65W Trinity part was on hand. The important thing to note is that within each power bracket, both the CPU frequencies and the supported memory changes depending on the architecture and the binning process AMD uses. The benchmarks in this review are run at the processors' maximum supported frequency, rather than any AMD Memory Profiles which the processor can also support via overclocking. This has implications in conjunction with the IPC or MHz difference.
For this review we also took a few Intel processors of varying TDPs:
| Intel TestBed | ||||||||
| SKU | Cores |
CPU / Turbo |
DRAM MHz |
Power | IGP | SPs |
GPU MHz |
|
| Sandy Bridge | i5-2500K | 4C/4T |
3.3 GHz 3.7 GHz |
1600 | 95W | HD 3000 | 12 | 850 |
| Ivy Bridge | i3-3225 | 2C/4T | 3.3 GHz | 1600 | 55W | HD 4000 | 16 | 550 |
| i7-3770K | 4C/8T |
3.5 GHz 3.9 GHz |
1600 | 77W | HD 4000 | 16 | 550 | |
| Haswell | i3-4330 | 2C/4T | 3.5 GHz | 1600 | 54W | HD 4600 | 20 | |
| i7-4770K | 4C/8T |
3.5 GHz 3.9 GHz |
1600 | 84W | HD 4600 | 20 | ||
|
i7-4770R + Iris Pro |
4C/8T |
3.2 GHz 3.9 GHz |
1600 | 65W | HD 5200 | 40 | ||
| Memory | ADATA XPG 2 x 8 GB DDR3L-1600 9-11-9 1.35V | |||||||
| Motherboards | ASUS Z87 Gryphon | |||||||
| Power Supply | OCZ 1250W ZX Series | |||||||
| Storage | OCZ 256GB Vertex 3 SSDs | |||||||
| Operating System | Windows 7 64-bit SP1 with Core Parking updates | |||||||
| Video Drivers |
15.28.20.64.3347 for HD 3000 15.33.8.64.3345 for HD 4000+4600 |
|||||||
Unfortunately our stock of i5 and i3 processors is actually rather limited – Intel prefers to source the i7s when we review those platforms, but I was able to use a personal i3-3225 from my NAS and we sourced the Haswell i3 as well. Given that Ganesh has the BRIX Pro in for review, I asked him to run as many benchmarks from our gaming suite as I could, to see how well Intel's Haswell eDRAM (Crystalwell) equipped processors stand up to Kaveri’s GCN mêlée.
For reference we also benchmarked the only mid-range GPU to hand - a HD 6750 while connected to the i7-4770K.
Overclocking and Underclocking the A10-7850K
As part of the final testing for this review we did some basic overclocking on the A10-7850K processor. Despite our processor being an engineering sample, we would assume that it is as close/identical to the retail silicon as you can get, given that this is meant to be a review on which people make purchasing decisions.
Our A10-7850K CPU starts out with a peak voltage under load of 1.24 volts when running OCCT. From this point we clocked back to 3.5 GHz and 1.100 volts, with a full-on CPU load line calibration and adjusted turbo mode to equal the base clock. Our standard overclocking test applies – OCCT for five minutes, PovRay, and new for 2014, a run of LuxMark. At our settings, we test the system for stability by running these tests. If the system fails, the CPU voltage is raised 0.025 volts until the system is stable during testing. When stable, the system multiplier is then raised and our testing moves on to the new MHz range.
Our results are as follows:
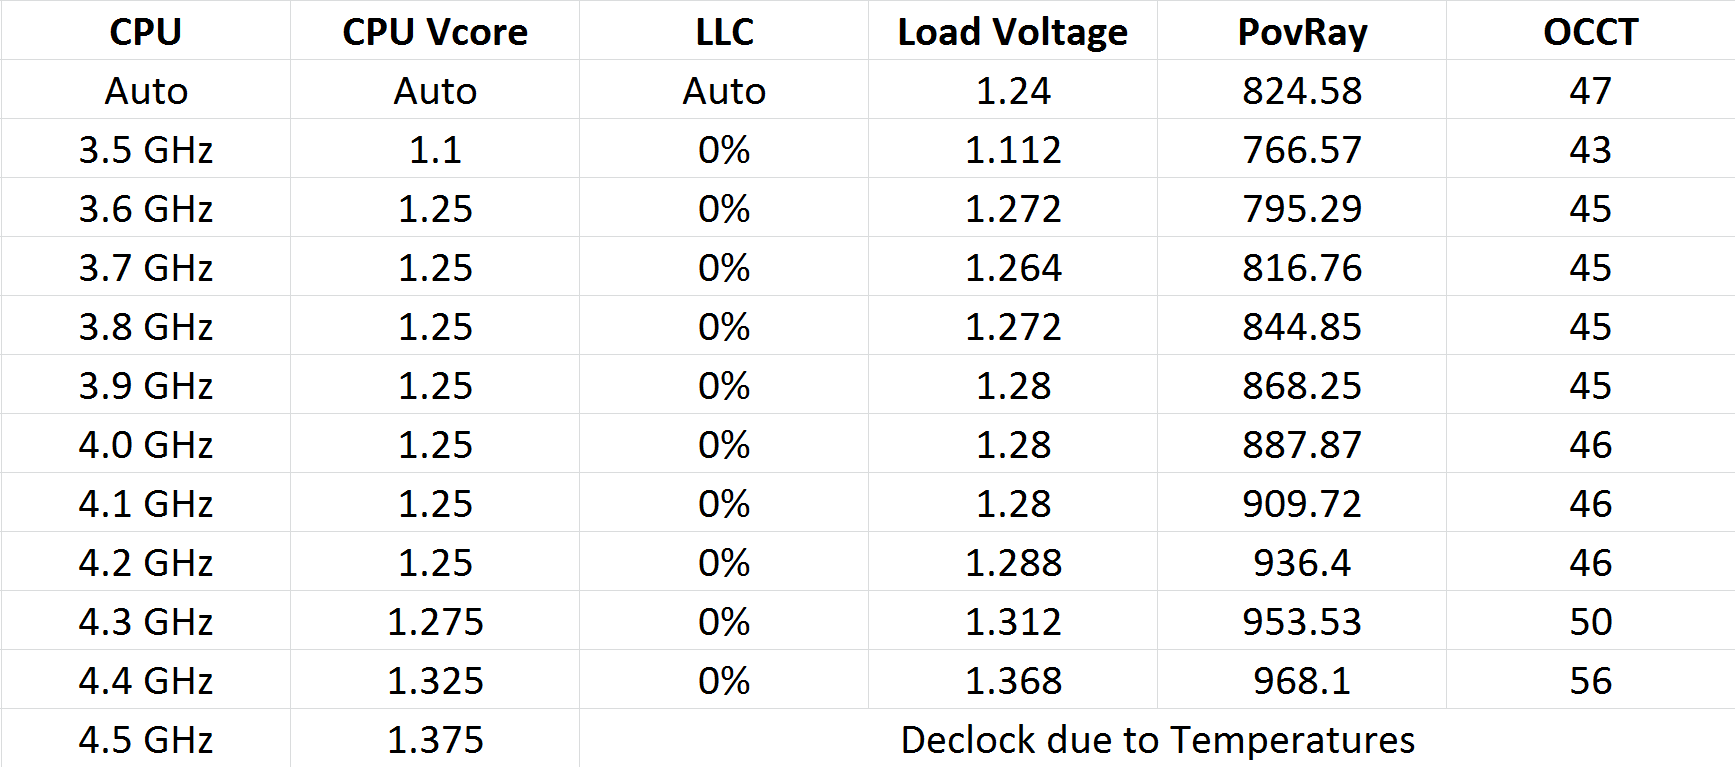
There was an unexpected jump in the voltage required to move from 3.5 GHz to 3.6 GHz (likely hitting the limits of what we can easily attain on this process). The system would not remain stable until 1.225 volts as set in the BIOS.
We also did the power tests, measuring the power draw at the wall as the delta between idle and OCCT load:
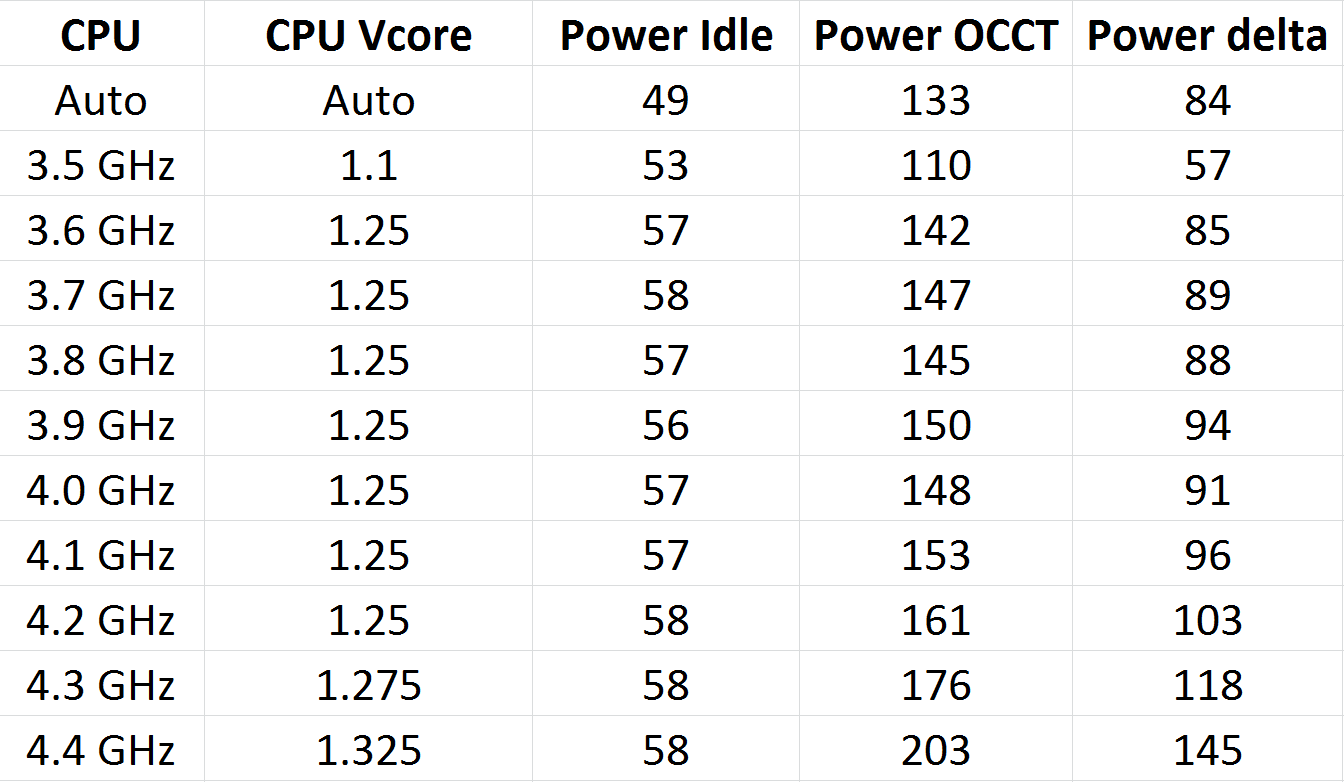
As expected, raising the voltage has a significant effect on the power consumption of the processor. One thing I should point out is that even at stock, the power delivery VRMs were getting very hot to touch – so much in fact that the system generated significant errors without an active fan on them. This got worse as the system was overclocked. I am not sure if this is an effect of the platform or the motherboard, but it will be something to inspect in our motherboard reviews going forward.


380 Comments
View All Comments
jjj - Tuesday, January 14, 2014 - link
lol now that AMD is paying you,you jumped at the other extreme , what do you get over Richland and how does that deserve a positive conclusion? (and maybe a reminder is needed A10-6800K is 140$)Drumsticks - Tuesday, January 14, 2014 - link
The author recognized that 100W TDP isn't really any different...? The 45W more mainstream range is where things are a lot more interesting, but please, ignore the 30+% gains.Conduit - Tuesday, January 14, 2014 - link
I have been waiting almost 2 years for a mobile Kaveri telling myself the wait will be worth it. Looks like it actually may be as Kaveri performs better at lower TDP's than Trinity and Richland.Hubb1e - Tuesday, January 14, 2014 - link
This guy actually gets it. These should make very nice cheap laptops able to actually play a game or two without vomiting all over themselves. At 95W the gains are not there, but at 45W it's impressiveJDG1980 - Tuesday, January 14, 2014 - link
What an odd choice of benchmarks. Why not use Photoshop (which supports OpenCL and is an important real-world application) instead of Agisoft (who?) I can't help but wonder if Agisoft paid for their inclusion in Anandtech's benchmark suite.ddriver - Tuesday, January 14, 2014 - link
You may notice that the entire review is not exactly OpenCL compute rich... I mean even for gaming cards AT usually includes several OpenCL benchmarks, but not for this product, where it is supposed to be its strongest point???Conduit - Tuesday, January 14, 2014 - link
I have to say, the 45W A8-7600 kicks ass. It's competitive with the 100W A10-5800K, I think that's where the benefit of Kaveri lies, in the low TDP department.UtilityMax - Tuesday, January 14, 2014 - link
Indeed. However, I personally would like to see benchmarks that measure the power draw. The 65watt TDP Richland A10s were nearly as power thirsty as the +100watt TDP parts. A8 does look interesting.thegreatjombi - Tuesday, January 14, 2014 - link
Any chance we can get HD5200 and HD5400 benches? The 5000 series has started to catch up with AMD in terms of GPU Compute. I am curious if AMD has left Intel in the dust once again, or has Intel actually made a big enough leap to stay in the game.thegreatjombi - Tuesday, January 14, 2014 - link
Oh! It seems the 5000 series is just omitted in the CPU Performance benchmarks? Why is that?