Google Nexus 5 Review
by Brian Klug on December 5, 2013 8:00 AM EST- Posted in
- Smartphones
- LG
- Android
- Mobile
- Snapdragon 800
- Android 4.4
- Nexus 5
Display on mobile devices is one area where we’ve seen considerable improvement. Pixel density has gone up, contrast ratios have improved, and the emphasis on low power in a platform gated by its battery size means there’s always innovation happening.
In the case of the Nexus 5, there’s a considerable jump in resolution, from the WXGA 1280x768 display on the Nexus 4, to the now-standard 1080p. The biggest change is an obvious shift in aspect ratio from 15:9 to 16:9 once more. Back with the Nexus 4 and Optimus G, I noted just how surprisingly noticeable that extra 48 pixels of width was. Although we tend to think in absolute display resolution and talk about it quite a bit, Android uses display independent pixels or dips in order to keep layouts display density agnostic and support a wide variety of screen sizes and resolutions. Nexus 5 implements the 480 ppi or xxhdpi screen density, whereas Nexus 4 implements 320 ppi or xhdpi density. The result is that the Nexus 5’s display is 360x592 dips in size, compared to 384x592 dips for the Nexus 4, coming in 24 dips narrower. It’s important to note however that this change is intentional to maintain Android’s DPI independence, even if it does mean less overall real-estate in apps and browser.
Display quality is a big deal in the Android space, with lots of variance between devices. In the case of the Nexus 5, I started by tracking down the display type. If you recall, 5-inches with 1080p is a resolution we’ve seen before in the Droid DNA and Butterfly. From what I can tell, the Nexus 5 uses a very similar evolved version of that panel, a JDI (Japan Display, Inc) 1080p display with in-cell touch courtesy Synaptics ClearPad 3350 solution.
The other question was whether Nexus 5 also uses a PSR (Panel Self Refresh) type display. This display is indeed a MIPI command mode panel, the same kind of system, so yes it does include those features. An additional change is the addition of software vsync in Android 4.4, which to my knowledge the Nexus 5 does use, you can see this pop on and off depending on what’s happening on-screen if you monitor surfaceflinger. Those improvements should decrease latency and improve how sticky animations feel.
To characterize display quality and accuracy, we turn to our usual display measurements.
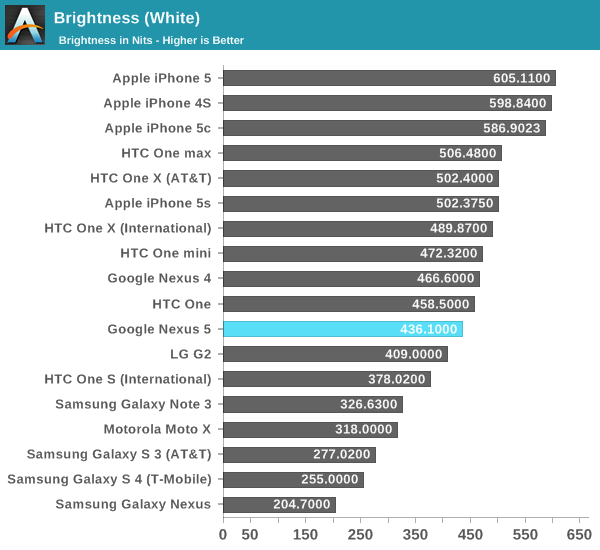
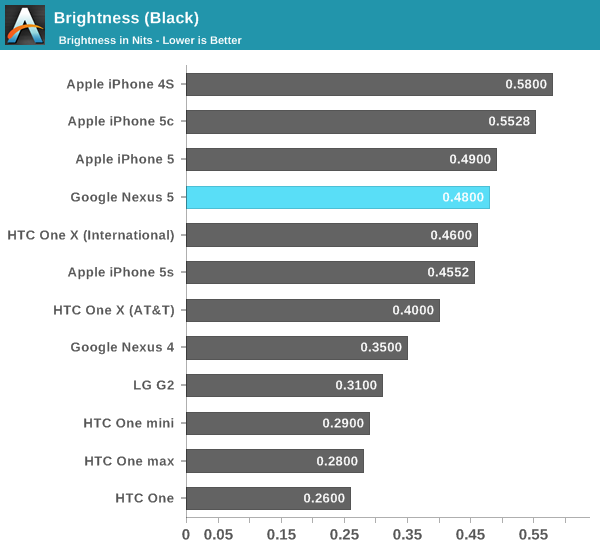
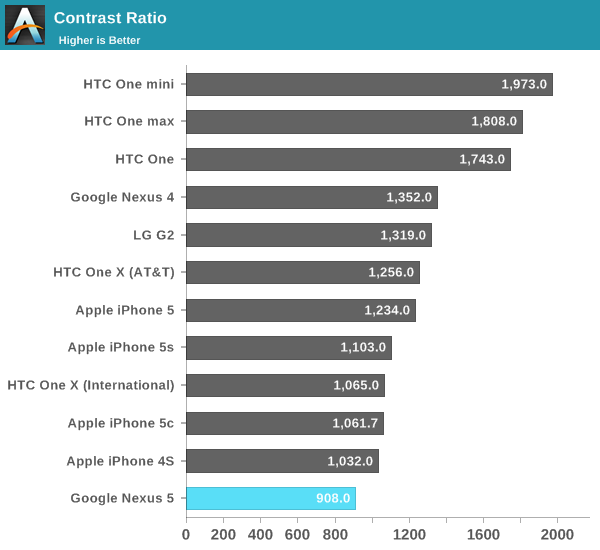
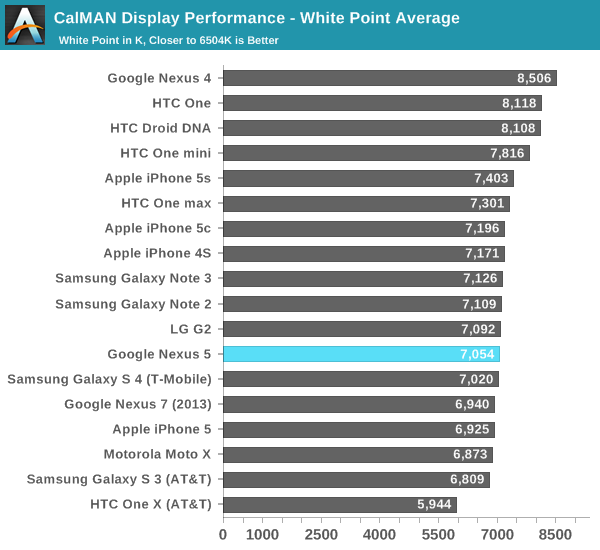
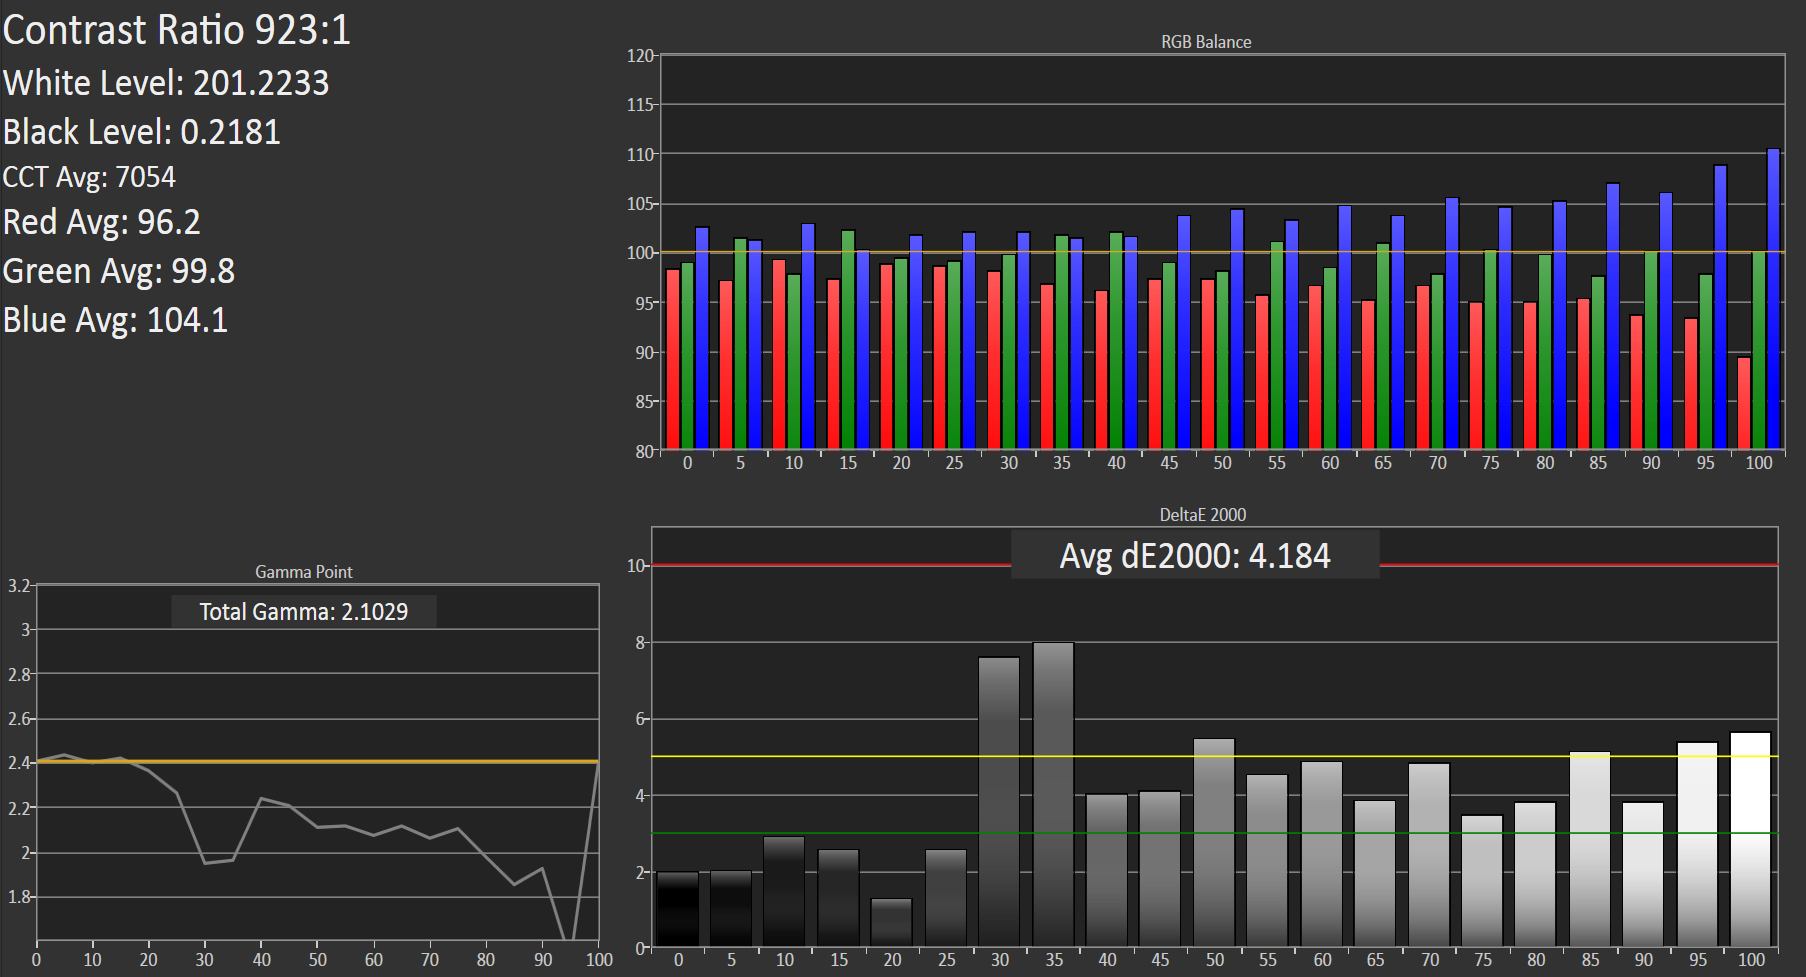
The Nexus 5 doesn’t go quite as bright as Nexus 4, but it’s still a very bright display. Blacks and contrast are a bit disappointing though, contrast is definitely on the lower end, but not bad. I definitely haven’t been put off by them. I also haven’t noticed any of the distracting dynamic brightness behavior I have on other handsets, which is awesome.
My only criticism is that I wish Nexus 5 would allow its auto screen brightness algorithm to go dimmer when in dark scenarios. There’s still more dynamic range in the manual brightness setting bar than there is for the auto brightness routine from what I can tell.
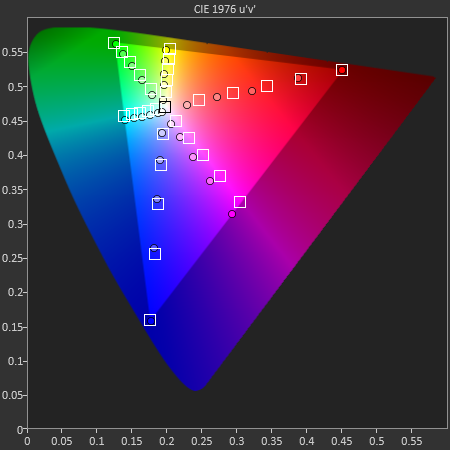
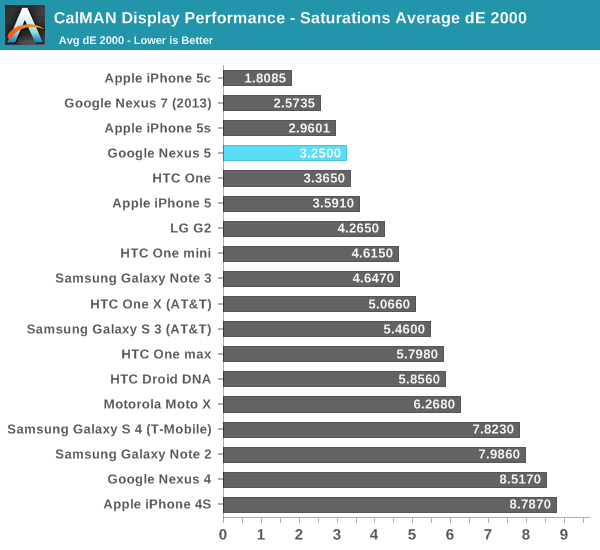
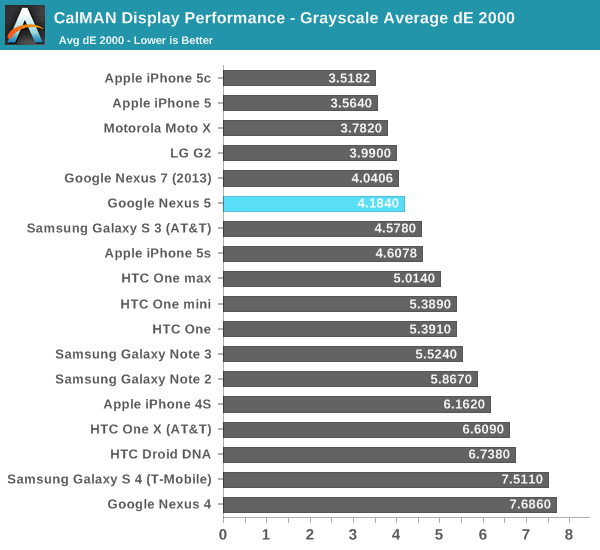
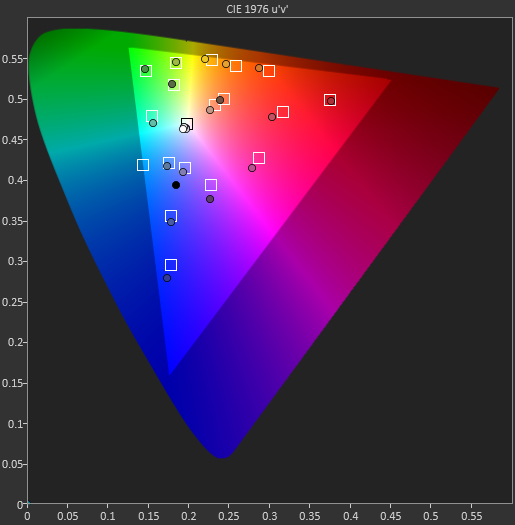
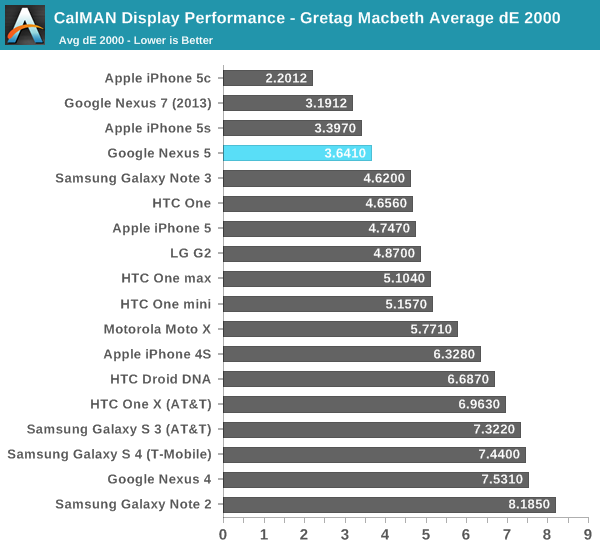
The new Nexus 7 impressed me with how accurate its display was in terms of color reproduction, beginning with Google stating it targeted sRGB (the color space for both the web and Android) calibration for it. The Nexus 5 seems to have done the same, and wowed me with the best GMB color checker Delta-Es we’ve seen from any Android handset. In addition, the Nexus 5 has none of the saturation boost that’s sadly quite pervasive right now, instead giving the right evenly spaced saturation stepping on its color channels. The Nexus 7 has slightly lower Delta-E, but it’s clear to me that Google has made color calibration an emphasis on the Nexus line.
It’s interesting to hear some Nexus 5 users complain that the display seems undersaturated, since that kind of end user feedback reflects subjective comparison. It also suggests to me that a large percentage of the population doesn’t know what some colors or system elements actually should be. Even for me, looking at the green elements inside the Google Play store on the Note 3 in movie mode or Nexus 5 initially seemed slightly more muted than normal. The reality is that this is what they actually should look like. We’ve just become accustomed to their oversaturated appearance on virtually every other device.
This kind of expectation about what looks right and what doesn’t is rather telling for the state of display calibration in Android handsets, and how OEMs have used oversaturated colors to increase retail shelf appeal. Unfortunately the reality is that oversaturated colors do seem to win taste tests among shoppers, the same way that TVs in most big boxes do. We’ve been looking at them for so long that well calibrated displays like Nexus 5 initially do look noticeably different.
The end result is easy to sum up, however – Nexus 5 has the best calibrated display I’ve seen so far in any Android handset. It’s also leaps and bounds more accurate and controlled than its predecessor display in the Nexus 4.


231 Comments
View All Comments
Pr3ch34r - Thursday, December 5, 2013 - link
Not-everyone-buy-a-nexus-for-300-fucking-dollarsPr3ch34r - Thursday, December 5, 2013 - link
I think he hit the jackpotffh2303 - Thursday, December 5, 2013 - link
About the charging time,my unit [a black 32GB D820] charges in under 90 minutes using a 2A Note 2 charger [Samsung ETA-U90UWE] while on. Using the Battery Monitor Widget by 3c I observed that while idling on the homescreen the phone consumes around 450mA [shown as -445mA in the app] and when I plug in the Note 2 charger it shows the phone is charging at around 1500mA [shown as +1500mA]. My charging time with the stock LG charger is the same as your findings though.rxzlmn - Thursday, December 5, 2013 - link
I wonder why the reported times from the battery life benchmarks are so much higher than any of the reported screen-on times in 'real-world' usage? I am not trying to discredit the data, just honestly curious. How does one get close to 9 hours of constant screen-on time while the phone is being used, and why is there not a single battery stat from phones in use anywhere close to that number?On a side note, do you plan on reviewing the Sony Z1? I am asking because it has generally received mixed reviews in terms of battery life, but actually seems to perform very good in 'real life' scenarios.
sherlockwing - Thursday, December 5, 2013 - link
Anandtech is one of the few sites that set all phone to the same brightness(200nits) when battery testing. What you see from other websites is that they test every phone at their auto-brightness or max brightness setting. That's why Anandtech's battery life benchmark results are different from other sites.rxzlmn - Thursday, December 5, 2013 - link
I'm talking about real usage, i.e. people who own the phone post screenshots of Android battery usage stats. Not benchmarks. The best you see for the N5 is 5 hours+, even with WiFi only.sherlockwing - Thursday, December 5, 2013 - link
Ofc having the phone run benchmark is going to result differently than real life usage since the scenario is different.Cinnabuns - Thursday, December 5, 2013 - link
The tests performed here are controlled and I imagine that the phone is not being moved around a whole lot during battery-life testing (and it shouldn't be). However, one of the nicest things about having a smartphone are location-aware services. And they drain the battery. A lot.Unfortunately, one of the biggest culprits is Google's own location reporting service, which itself is integral to various Google Now features.
Of course, there are also various bugs that people in the real world encounter that are not triggered by the very specific test conditions in the battery life tests here. For example, Android 4.3 had a bug that could cause a phone to never "deep sleep" after wireless charging. But there's really no way for a review site to try to hunt down all the battery bugs and reproduce them. That's not really within scope of a battery life test and reviewers aren't paid to do QA on a phone, so they can only report on specific bugs they encounter in their personal use of the device (or bugs that are so heinously obvious that everybody has heard about already).
In short, there's no way a review site knows what YOUR "real-world" usage is. So the best thing they can do is to perform a controlled study with a published methodology and report the results. You get to interpret whether that methodology can be extrapolated to your own "real life" use. Sadly, other "review" sites somehow extrapolate their own unscientific experience as representative of real life usage when in truth, there is no universal real-lifeusage.
Impulses - Friday, December 6, 2013 - link
At the end of the day what matters most is that AT's testing is under controlled circumstances SMS repeatable, thus you get a very fair relative comparison between the tested phones. You may not get 9 hours on wifi if you aren't sitting next to the router, at X brightness, with zero background syncs, etc etc; but you can easily tell whether phone A will so better than phone B based on their tests. Isn't that all that really matters when you're trying to decide whether to buy A or B?Impulses - Friday, December 6, 2013 - link
SMS = andWTB comment edit