The AMD Radeon R9 290X Review
by Ryan Smith on October 24, 2013 12:01 AM EST- Posted in
- GPUs
- AMD
- Radeon
- Hawaii
- Radeon 200
Synthetics
As always we’ll also take a quick look at synthetic performance. The 290X shouldn’t pack any great surprises here since it’s still GCN, and as such bound to the same general rules for efficiency, but we do have the additional geometry processors and additional ROPs to occupy our attention.
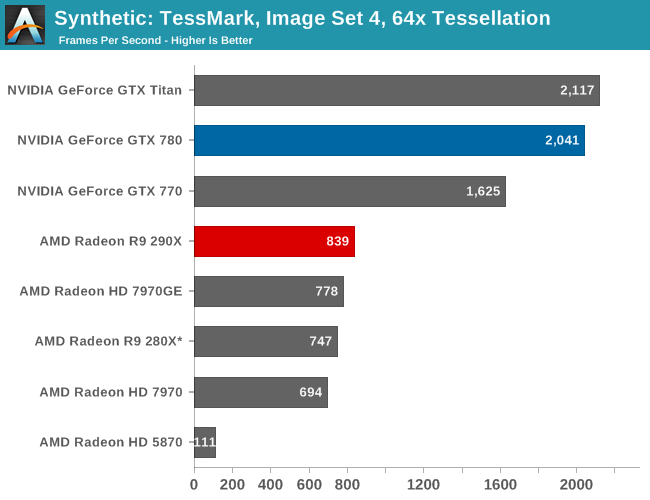
Right off the bat then, the TessMark results are something of a head scratcher. Whereas NVIDIA’s performance here has consistently scaled well with the number of SMXes, AMD’s seeing minimal scaling from those additional geometry processors on Hawaii/290X. Clearly Tessmark is striking another bottleneck on 290X beyond simple geometry throughput, though it’s not absolutely clear what that bottleneck is.
This is a tessellation-heavy benchmark as opposed to a simple massive geometry bencehmark, so we may be seeing a tessellation bottleneck rather than a geometry bottleneck, as tessellation requires its own set of heavy lifting to generate the necessary control points. The 12% performance gain is much closer to the 11% memory bandwidth gain than anything else, so it may be that the 280X and 290X are having to go off-chip to store tessellation data (we are after all using a rather extreme factor), in which case it’s a memory bandwidth bottleneck. Real world geometry performance will undoubtedly be better than this – thankfully for AMD this is the pathological tessellation case – but it does serve of a reminder of how much more tessellation performance NVIDIA is able to wring out of Kepler. Though the nearly 8x increase in tessellation performance since 5870 shows that AMD has at least gone a long way in 4 years, and considering the performance in our tessellation enabled games AMD doesn’t seem to be hurting for tessellation performance in the real world right now.
Moving on, we have our 3DMark Vantage texture and pixel fillrate tests, which present our cards with massive amounts of texturing and color blending work. These aren’t results we suggest comparing across different vendors, but they’re good for tracking improvements and changes within a single product family.
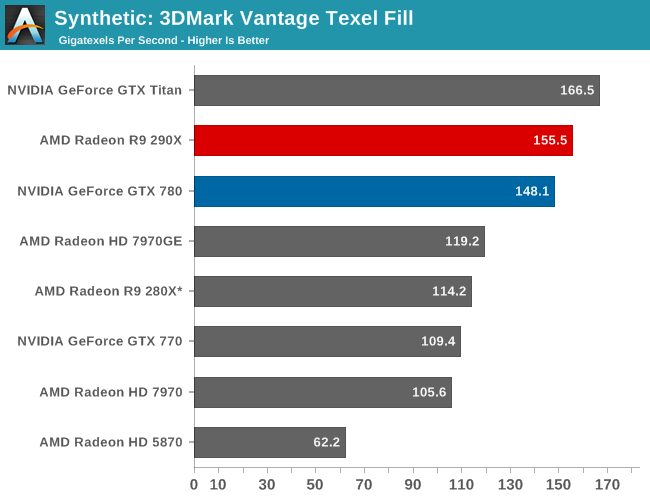
Looking first at texturing performance, we can see that texturing performance is essentially scaling 1:1 with what the theoretical numbers say it should. 36% better texturing performance over 280X is exactly in line with the increased number of texture units versus 280X, at the very least proving that 290X isn’t having any trouble feeding the increased number of texture units in this scenario.
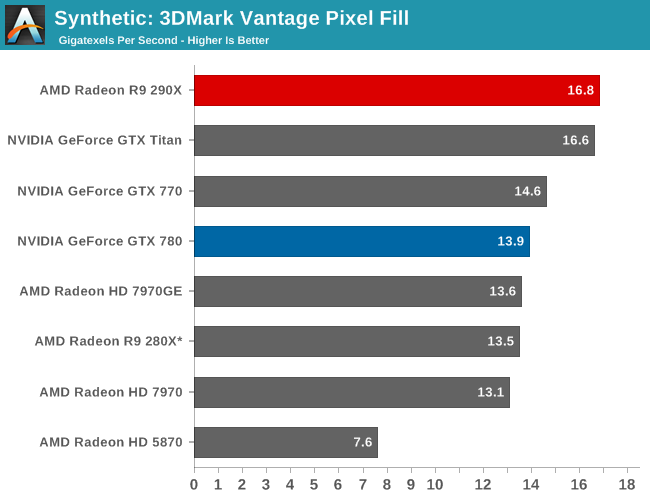
Meanwhile for our pixel fill rates the results are a bit more in the middle, reflecting the fact that this test is a mix of ROP bottlenecking and memory bandwidth bottlenecking. Remember, AMD doubled the ROPs versus 280X, but only gave it 11% more memory bandwidth. As a result the ROPs’ ability to perform is going to depend in part on how well color compression works and what can be recycled in the L2 cache, as anything else means a trip to the VRAM and running into those lesser memory bandwidth gains. Though the 290X does get something of a secondary benefit here, which is that unlike the 280X it doesn’t have to go through a memory crossbar and any inefficiencies/overhead it may add, since the number of ROPs and memory controllers is perfectly aligned on Hawaii.


396 Comments
View All Comments
Deaks2 - Thursday, October 24, 2013 - link
Hi Ryan,While I can appreciate the hard work put into the review, just putting up the charts without the explainer pieces is confusing. I had to read HardOCP's review to know what Uber was, your section on Powertune was a work in progress. Also, reading the temperature information was shocking, until, again, I read the relevant section of the HardOCP review and learned that the cards will operate at 95 deg C in order to reduce fan noise.
Also, a comparison to the 7990, the current single-slot performance king, would have been useful, since the R9 290x and 7990 are currently priced similarly. Thankfully, TechSpot included the 7990 and various 7970 and 7950 CF configurations in their review.
As usual, I came to this site first to read the review, but had to go elsewhere to get the context to the charts that you presented.
Thanks!
BryanC - Thursday, October 24, 2013 - link
Actually, I value your commentary more than the charts, which to be honest are similar to the other charts out there. =)anubis44 - Thursday, October 24, 2013 - link
Oh, I'm here for the crafty journalism and the witty banter in the discussion thread :)Seriously, thanks for going the extra mile with the crossfire and FCAT data, Ryan. Much appreciated. Any word on custom cards and the R9 290 (as opposed to the 290X) would also be greatly appreciated. The R9 290 may be my next card.
jeremynsl - Thursday, October 24, 2013 - link
I don't mean to rag on you guys (up late working and all), but it is unprofessional to post unfinished reviews like this. Full stop.I know you have made commitments to hit embargo dates, but is it really worth compromising article quality to this degree? I mean, even if only 10% of readers see it in the unfinished state it's pretty bad. I would not be ok with this, if it was my site and/or my writing.
ZeDestructor - Thursday, October 24, 2013 - link
Like quite a few other people, I would rather read the technical breakdown rather than the benchmark results. If I only cared about benchmark results, I would go around compiling results from several sites to account for configuration differences.It really boils down to preferring a complete review over a performance review. For performance there's the bench tool already, which is far more useful since I can filter out all the irrelevant results
Ryan Smith - Monday, October 28, 2013 - link
Hi guys;Your comments have been heard, so please don't think they're falling on deaf ears.
Frankly we're no more happy about this than the rest of you are, which is why we try to avoid something like this if at all possible. But in this case we can't do a meaningful write-up without the benchmark data, so there's really no getting around it in this case.
The final article ended up being a hair over 22K words. That would normally be a week-long writing job, never mind the benchmarking (new GPU + CF). So I hope if nothing else the belatedly complete article is up to your standards as our readers.
Black Obsidian - Tuesday, October 29, 2013 - link
I would definitely agree that the complete article is up to the standards I've come to expect from Anandtech.But I would also much prefer to wait an extra day or two for the complete article, rather than get the "fill in the blanks" that the 290X review started out as. I come to Anandtech for the in-depth analysis; if that's not available when I click on the article in the first place, I'm less inclined to even bother.
Stuka87 - Thursday, October 24, 2013 - link
Incredible bang for the buck card. $550 is a chunk of money yes, but compared to the competition its a steal!tential - Thursday, October 24, 2013 - link
Jumped to Final Words and it's a work in Progress...That's my favorite part and it's the one I real first!!!!
nooooo.
Elixer - Thursday, October 24, 2013 - link
Looks like nice card...No wonder the green team got their panties in a bind.