Corsair Force LS (240GB) Review
by Kristian Vättö on September 25, 2013 12:00 AM ESTAnandTech Storage Bench 2011
Two years ago we introduced our AnandTech Storage Bench, a suite of benchmarks that took traces of real OS/application usage and played them back in a repeatable manner. Anand assembled the traces out of frustration with the majority of what we have today in terms of SSD benchmarks.
Although the AnandTech Storage Bench tests did a good job of characterizing SSD performance, they weren't stressful enough. All of the tests performed less than 10GB of reads/writes and typically involved only 4GB of writes specifically. That's not even enough exceed the spare area on most SSDs. Most canned SSD benchmarks don't even come close to writing a single gigabyte of data, but that doesn't mean that simply writing 4GB is acceptable.
Originally we kept the benchmarks short enough that they wouldn't be a burden to run (~30 minutes) but long enough that they were representative of what a power user might do with their system. Later, however, we created what we refer to as the Mother of All SSD Benchmarks (MOASB). Rather than only writing 4GB of data to the drive, this benchmark writes 106.32GB. This represents the load you'd put on a drive after nearly two weeks of constant usage. And it takes a long time to run.
1) The MOASB, officially called AnandTech Storage Bench 2011—Heavy Workload, mainly focuses on the times when your I/O activity is the highest. There is a lot of downloading and application installing that happens during the course of this test. Our thinking was that it's during application installs, file copies, downloading, and multitasking with all of this that you can really notice performance differences between drives.
2) We tried to cover as many bases as possible with the software incorporated into this test. There's a lot of photo editing in Photoshop, HTML editing in Dreamweaver, web browsing, game playing/level loading (Starcraft II and WoW are both a part of the test), as well as general use stuff (application installing, virus scanning). We included a large amount of email downloading, document creation, and editing as well. To top it all off we even use Visual Studio 2008 to build Chromium during the test.
The test has 2,168,893 read operations and 1,783,447 write operations. The IO breakdown is as follows:
| AnandTech Storage Bench 2011—Heavy Workload IO Breakdown | ||||
| IO Size | % of Total | |||
| 4KB | 28% | |||
| 16KB | 10% | |||
| 32KB | 10% | |||
| 64KB | 4% | |||
Only 42% of all operations are sequential; the rest ranges from pseudo to fully random (with most falling in the pseudo-random category). Average queue depth is 4.625 IOs, with 59% of operations taking place in an IO queue of 1.
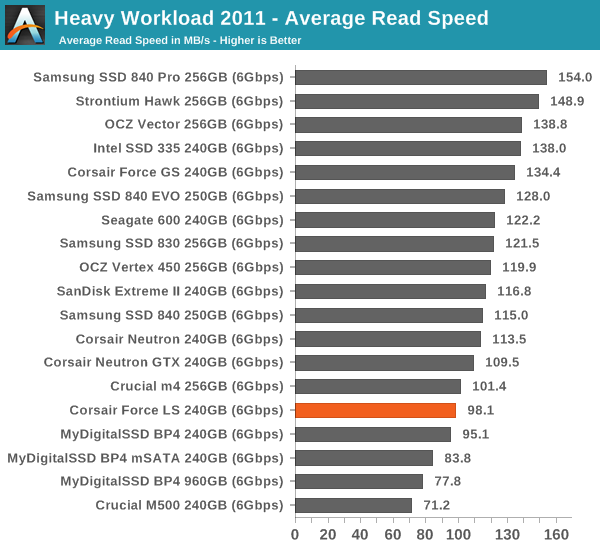
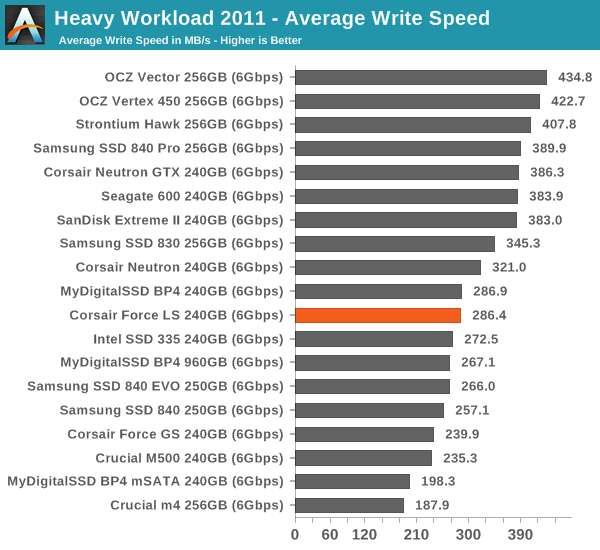
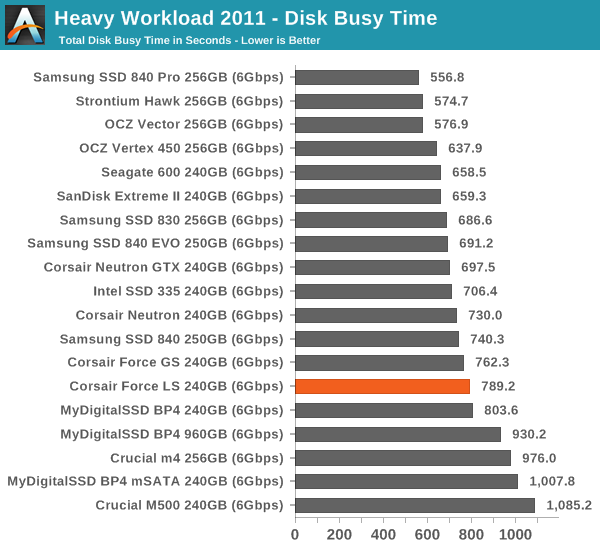
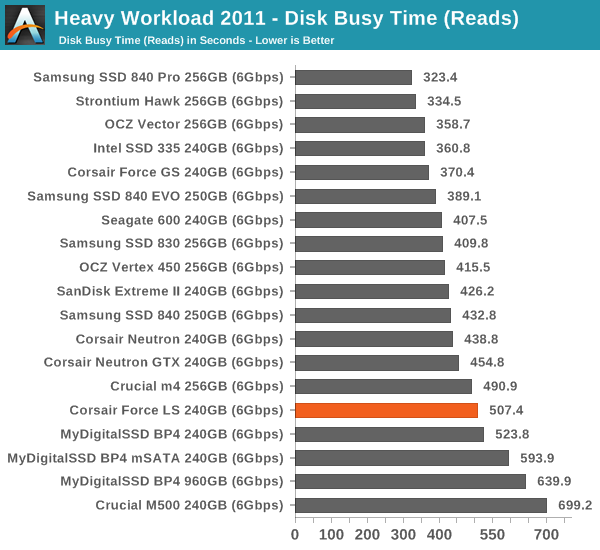
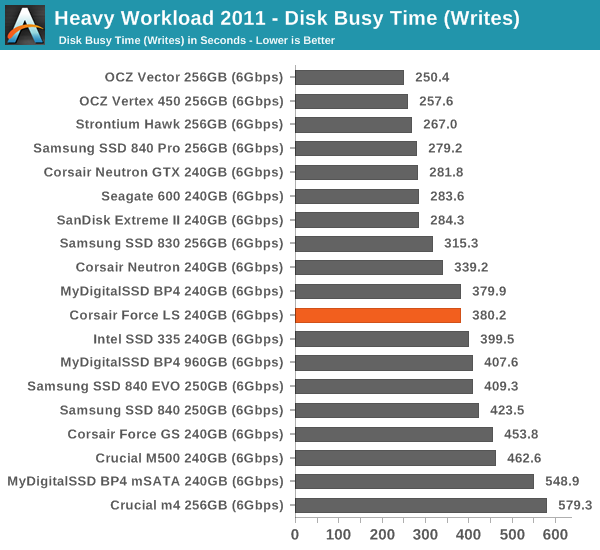
Many of you have asked for a better way to really characterize performance. Simply looking at IOPS doesn't really say much. As a result we're going to be presenting Storage Bench 2011 data in a slightly different way. We'll have performance represented as Average MB/s, with higher numbers being better. At the same time we'll be reporting how long the SSD was busy while running this test. These disk busy graphs will show you exactly how much time was shaved off by using a faster drive vs. a slower one during the course of this test. Finally, we will also break out performance into reads, writes, and combined. The reason we do this is to help balance out the fact that this test is unusually write intensive, which can often hide the benefits of a drive with good read performance.
There's also a new light workload for 2011. This is a far more reasonable, typical every day use case benchmark. It has lots of web browsing, photo editing (but with a greater focus on photo consumption), video playback, as well as some application installs and gaming. This test isn't nearly as write intensive as the MOASB but it's still multiple times more write intensive than what we were running last year.
We don't believe that these two benchmarks alone are enough to characterize the performance of a drive, but hopefully along with the rest of our tests they will help provide a better idea. The testbed for Storage Bench 2011 has changed as well. We're now using a Sandy Bridge platform with full 6Gbps support for these tests.
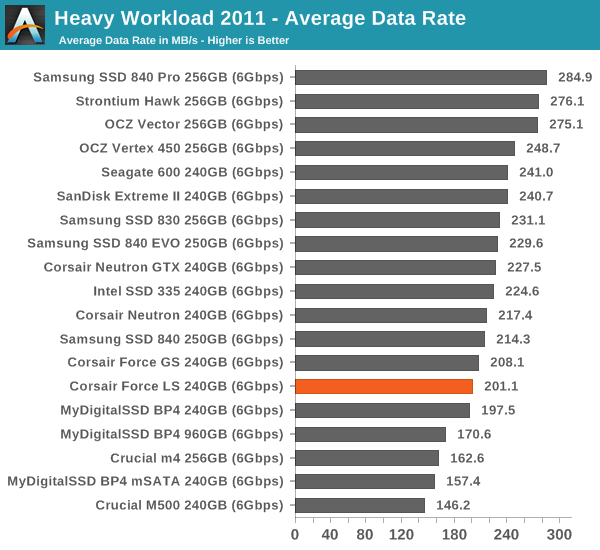
AnandTech Storage Bench 2011—Heavy Workload
We'll start out by looking at average data rate throughout our heavy workload test. The Corsair Force LS (and Phison) tend to be in the bottom third of the graphs, but overall performance is still reasonable for a budget drive.


25 Comments
View All Comments
Kristian Vättö - Thursday, September 26, 2013 - link
"Yellow on white is usually hard to see though."The color used in this review is orange, does it look yellow-ish in your browser?
"Also, you'd need one more color as there are 8 drives tested."
Are you suggesting that we should use a different color for each drive? I think that just adds confusion because the drive in review would no longer be differentiated from the others. Or did you mean something else?
erple2 - Thursday, September 26, 2013 - link
Rgb plus CMYK is 7 colors. I think that the poster implied that if you used those colors, you'd still need to come up with an eighth color, as you show the performance vs transfer graphs for 8 drives. The other graphs IMO are fine.Urizane - Friday, September 27, 2013 - link
Off of the top of my head? Try:#E02040
#E08820
#E0D040
#70D040
#60C0B0
#6090E0
#9070FF
#D060C0
There are 8 colors. They should be just high contrast enough with a white background. You can even throw in a grey and a black line if you need it.
Phasenoise - Wednesday, September 25, 2013 - link
I would appreciate a second line in the benchmark graphs which explain the controller used by that particular drive at a glance.Hrel - Wednesday, September 25, 2013 - link
The final paragraph of this article sums up my exact thoughts on this whole topic. Not sure what these businesses are thinking; in terms of what market is there. Perhaps they're just throwing resources at these things, creating and marketing them and hoping they net a profit. On the other hand they probably CAN do that given the margins on NAND memory.Wish they'd aggressively price cut to create an actual budget segment for SSD's. $150 gets me a Plextor or Sandisk on amazon with 256GB of storage space and upper level performance. Means you have to get your 256gb drive down to $100 to sell it to me. Good luck.