Samsung SSD 840 EVO Review: 120GB, 250GB, 500GB, 750GB & 1TB Models Tested
by Anand Lal Shimpi on July 25, 2013 1:53 PM EST- Posted in
- Storage
- SSDs
- Samsung
- TLC
- Samsung SSD 840
Random Read/Write Speed
The four corners of SSD performance are as follows: random read, random write, sequential read and sequential write speed. Random accesses are generally small in size, while sequential accesses tend to be larger and thus we have the four Iometer tests we use in all of our reviews.
Our first test writes 4KB in a completely random pattern over an 8GB space of the drive to simulate the sort of random access that you'd see on an OS drive (even this is more stressful than a normal desktop user would see). I perform three concurrent IOs and run the test for 3 minutes. The results reported are in average MB/s over the entire time. We use both standard pseudo randomly generated data for each write as well as fully random data to show you both the maximum and minimum performance offered by SandForce based drives in these tests. The average performance of SF drives will likely be somewhere in between the two values for each drive you see in the graphs. For an understanding of why this matters, read our original SandForce article.
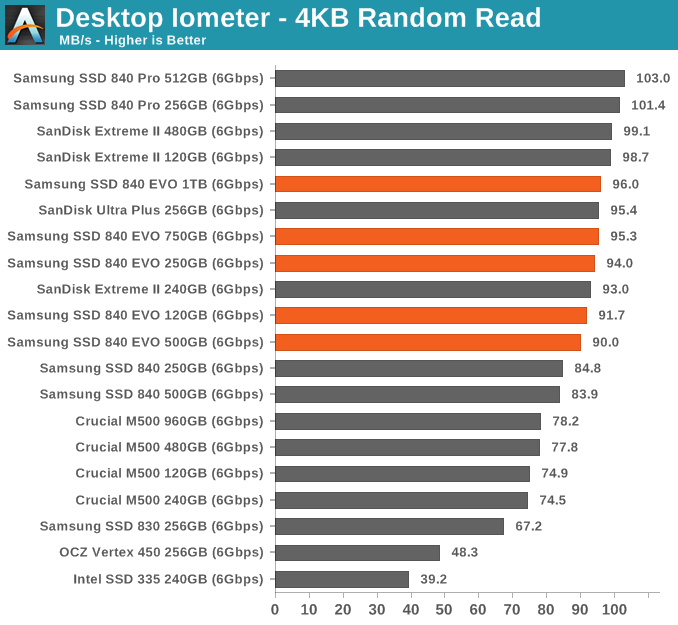
Random read speed is very close to that of the 840 Pro. The EVO doesn't look like a mainstream drive here at all.
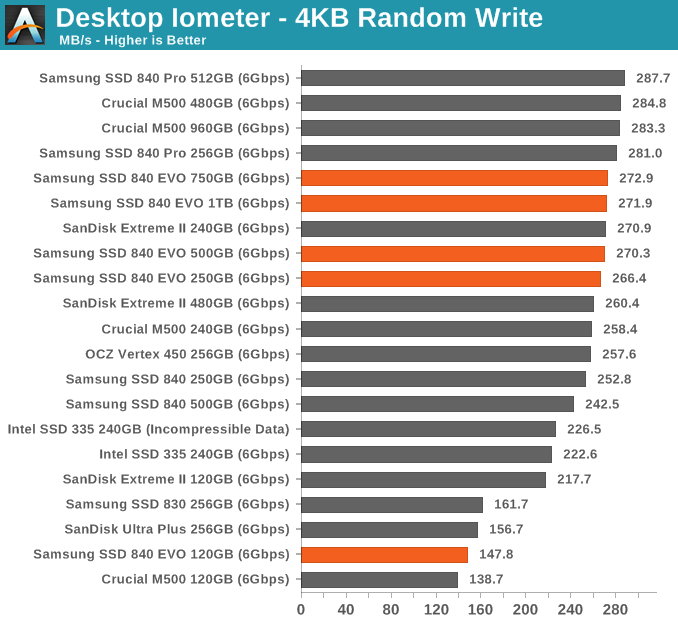
Even peak random write performance is dangerously close to the 840 Pro. Only the 120GB drive shows up behind the pack. I should add that I'll have to redo the way we test 4KB random writes given how optimized current firmwares/architectures have become. The data here is interesting but honestly the performance consistency data from earlier is a better look at what happens to 4KB random write performance over time.
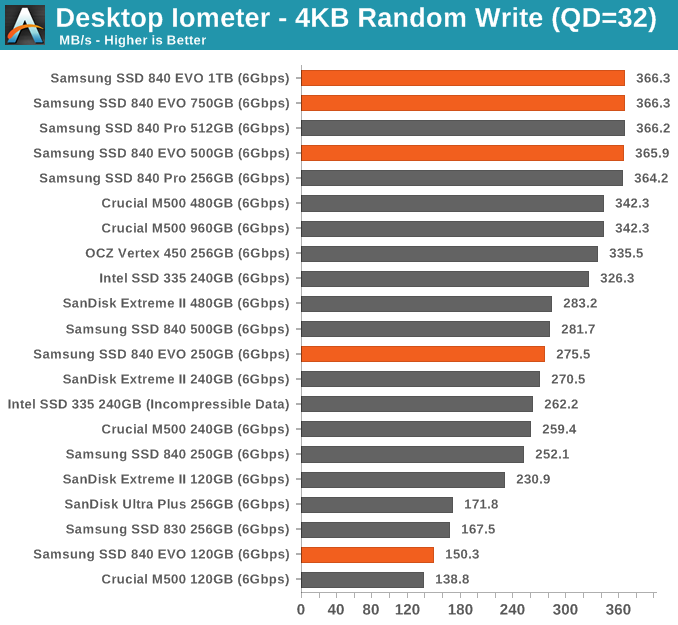
The relatively small difference between QD3 and QD32 random write performance shows you just how good of a job Samsung's controller is doing at write combining. At high queue depths the EVO is just as fast as the 840 Pro here. So much for TLC being slow.
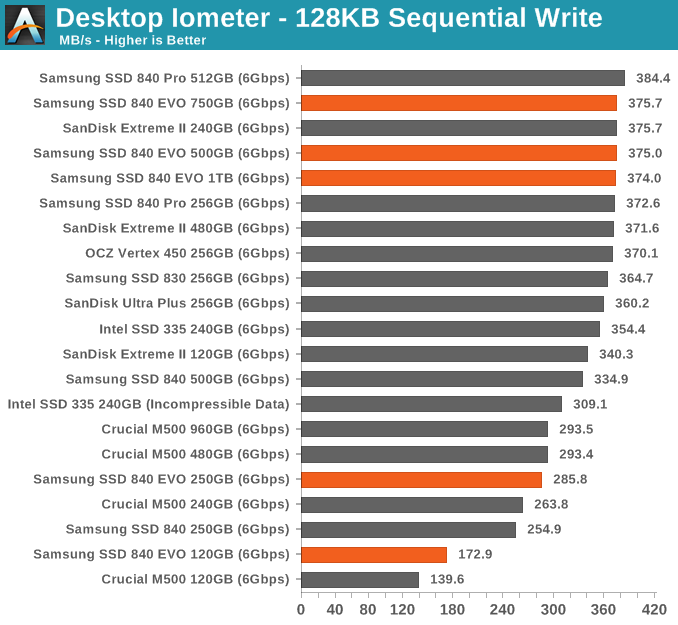
Sequential Read/Write Speed
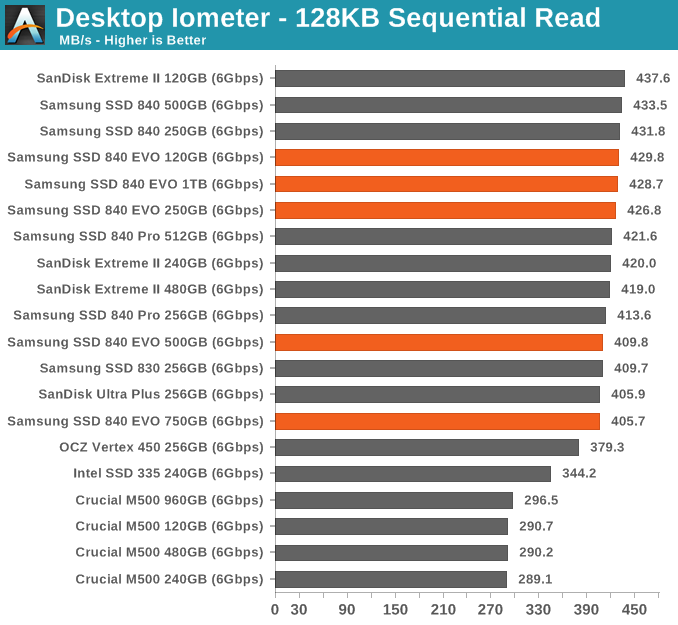
To measure sequential performance I ran a 1 minute long 128KB sequential test over the entire span of the drive at a queue depth of 1. The results reported are in average MB/s over the entire test length.
Sequential read and write performance, even at low queue depths is very good on the EVO. You may notice lower M500 numbers here than elsewhere, the explanation is pretty simple. We run all of our read tests after valid data has been written to the drive. Unfortunately the M500 attempts to aggressively GC data on the drive, so even though we fill the drive and then immediately start reading back the M500 is already working in the background which reduces overall performance here.
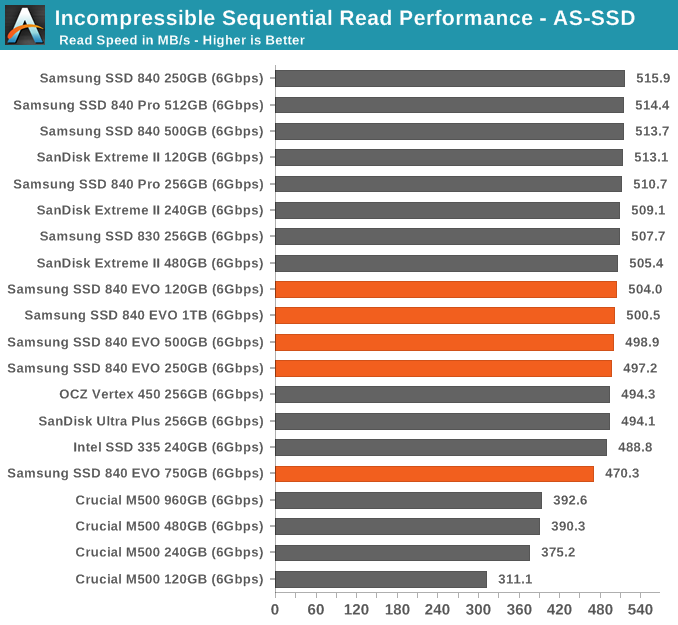
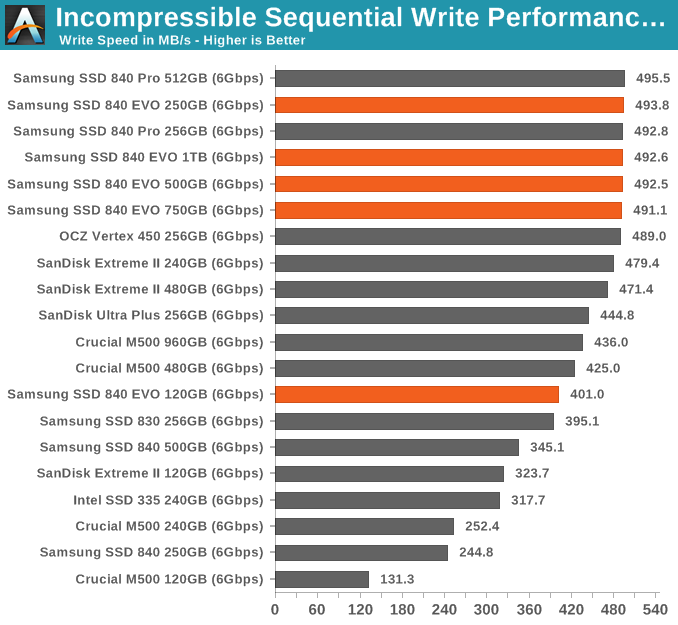
AS-SSD Incompressible Sequential Read/Write Performance
The AS-SSD sequential benchmark uses incompressible data for all of its transfers. The result is a pretty big reduction in sequential write speed on SandForce based controllers.


137 Comments
View All Comments
Riven98 - Thursday, July 25, 2013 - link
Anand,Thanks for the great article. I had just been thinking that there had been a downturn in the number of articles like these, which are the main reasons I visit on an almost daily basis.
chrnochime - Friday, July 26, 2013 - link
Still recommending a technology that's known to not last as long as the MLC. Yes the *extropolated* result indicates that its lifetime is far longer than advertised, but really, why when even M500 is not that slow in the first place and cost about the same, why risk going with the TLC? Not to mention Samsung's 830 has its fair share of horror stories as well...watersb - Friday, July 26, 2013 - link
Excellent review.How does write amplification scale as the disk fills up? Wouldn't a full disk fail more rapidly than a half-full one?
BobAjob2000 - Tuesday, January 28, 2014 - link
Hopefully wear leveling and TRIM/garbage collection algorithms should take care of your concerns. They should take existing unchanged 'cold' data and move it around to make way for regularly changed 'hot' data. This should reduce the impact of both data longevity and write amplification as it guides new writes to hit the 'freshest' unused or rarely written blocks on the disk and also helps to ensure that data goes not go 'stale' after being untouched for years. Different vendors use different algorithms that have evolved and improved over time. I think Samsung (being a RAM manufacturer) can possibly provide better RAM caches for their disks that may provide advantages for garbage collection and wear leveling algorithms by improving the available 'thinking space' for the caching and sorting/organizing of 'hot' data.Its all to do with managing the 'temperature' of your data somewhat like a data 'weather forecast' which can be very useful in the short term or for simple predictable/settled patterns but less practical for long term or unseasonal data storms.
Would like to see these things tested by 'what if' scenarios though to demonstrate the differences between different vendors algorithms.
xtreme2k - Friday, July 26, 2013 - link
Can anyone tell me why I am paying 90% of the price for 33% of the endurance of a drive?MrSpadge - Saturday, July 27, 2013 - link
Because endurance doesn't matter (very likely also for you), but price does.log - Friday, July 26, 2013 - link
Can you partition this drive and still take advantage of its features? ThnaksTimur Born - Friday, July 26, 2013 - link
I don't quite understand exactly why the Samsung RAPID software cache brings higher performance in *practice* than Windows' own cache? Using two software caches will lead to the same information being stored in RAM twice or even thrice, which is exactly what the Windows cache tries to avoid since XP days.That the usual benchmark programs get fooled is visible, as they think to be working without a software cache. So the higher values there are not surprising. But I am a bit puzzled why the Anand Storage Bench results increase, too?! Why is RAPID software caching better than Windows' own cache in this scenario? Or does the ASB bypass Windows' cache, too (like most benchmarks)?
By the way: ATTO allows the Windows cache to be turned ON for testing. My "old" Crucial M4 256 gets sees very high read results once ATTO makes use of Windows' cache. Only the write rates remain significantly smaller.
Therefor an ATTO test with combinations of either or both software caches (RAPID and Windows) would be interesting.
MrSpadge - Saturday, July 27, 2013 - link
I think it's because Samsung is being much more agressive with caching than Win dares to be, i.e. it holds files far longer before writing them, so they can be combined more efficiently but are longer at risk of being lost.Timur Born - Sunday, July 28, 2013 - link
I am not convinced about that yet, especially since you can turn off drive cache flushing via Device-Manager and thus should get an even more aggressive Windows cache behavior than what RAPID offers (which is reported to adhere to Windows' flush commands).The Windows cache is designed to keep data in RAM for as long as it's not needed for something else. Even more important, data is *directly* executed from inside the Windows cache instead of being copied back and forth between separate memory regions. This keeps duplication to a minimum (implemented since XP as far as I remember). So at least for reads the Windows cache is very useful, especially in combination with Superfetch, which is *not* disabled for SSDs btw (even Prefetch for the boot phase isn't disabled, but in practice it makes not much of a difference whether you boot with or without Prefetch from an SSD).
There is something funky going on with Windows' cache and the drive's onboard cache of my Crucial M4 in combination with ATTO (Windows cache enabled). Different block sizes get very different results, with some *larger* block sizes not benefiting from Windows' cache either at read or write, the latter depending on the block size chosen. Turning the drive's own cache flushing on/off via Device-Manager can have an impact on that, too.
In some cases I get less throughput with Windows cache than without (i.e. 512 kb block size with drive flushing on). This may be an issue of ATTO, though, because I also got some measurements where ATTO claimed a write speed of zero (0)! Turning off either drive cache flushing or the Windows cache or both helps ATTO to get meaningful measurements again.
So the main question remains: How and why would RAPID affect "real-world" performance on top of the Windows cache and does the Anand Storage Bench deliberately circumvent the Windows cache?
The reason I was looking at this review was that I am currently looking for a new SSD to build a desktop PC and the 840 EVO looks like the thing to buy. So once I get my hands on one myself I will just try RAPID myself. ;)