Samsung SSD 840 EVO Review: 120GB, 250GB, 500GB, 750GB & 1TB Models Tested
by Anand Lal Shimpi on July 25, 2013 1:53 PM EST- Posted in
- Storage
- SSDs
- Samsung
- TLC
- Samsung SSD 840
Performance Consistency
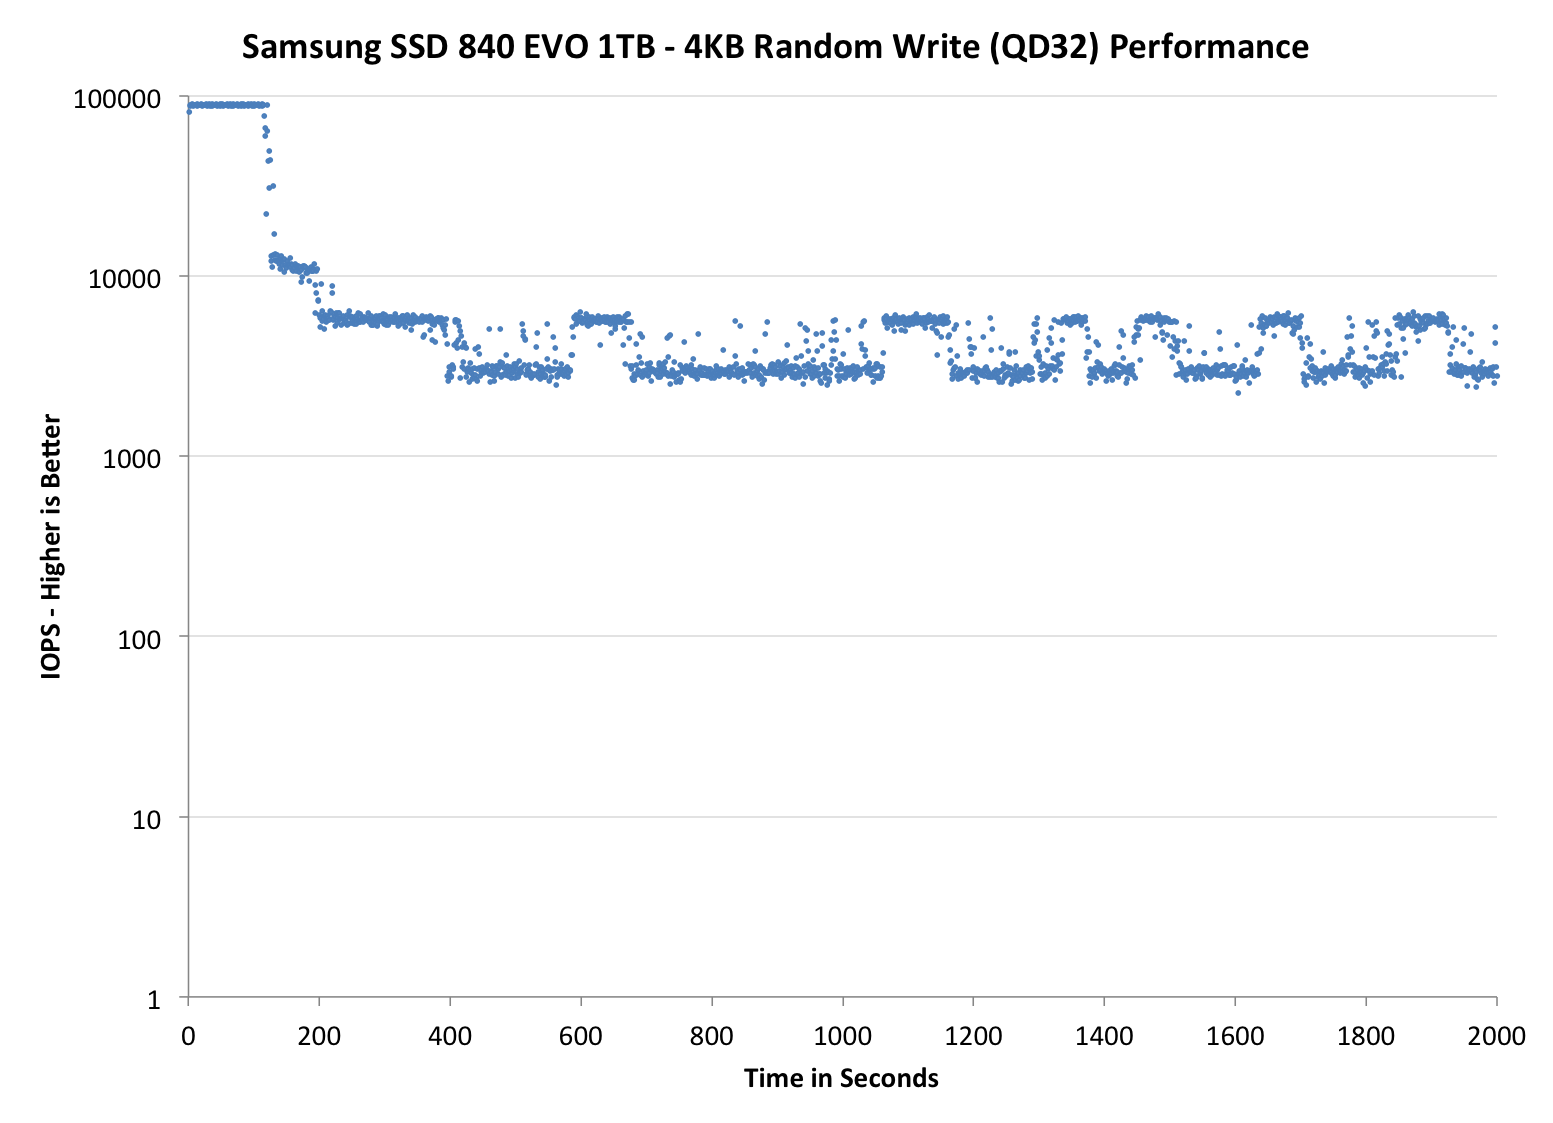
In our Intel SSD DC S3700 review I introduced a new method of characterizing performance: looking at the latency of individual operations over time. The S3700 promised a level of performance consistency that was unmatched in the industry, and as a result needed some additional testing to show that. The reason we don't have consistent IO latency with SSDs is because inevitably all controllers have to do some amount of defragmentation or garbage collection in order to continue operating at high speeds. When and how an SSD decides to run its defrag and cleanup routines directly impacts the user experience. Frequent (borderline aggressive) cleanup generally results in more stable performance, while delaying that can result in higher peak performance at the expense of much lower worst case performance. The graphs below tell us a lot about the architecture of these SSDs and how they handle internal defragmentation.
To generate the data below I took a freshly secure erased SSD and filled it with sequential data. This ensures that all user accessible LBAs have data associated with them. Next I kicked off a 4KB random write workload across all LBAs at a queue depth of 32 using incompressible data. I ran the test for just over half an hour, no where near what we run our steady state tests for but enough to give me a good look at drive behavior once all spare area filled up.
I recorded instantaneous IOPS every second for the duration of the test. I then plotted IOPS vs. time and generated the scatter plots below. Each set of graphs features the same scale. The first two sets use a log scale for easy comparison, while the last set of graphs uses a linear scale that tops out at 40K IOPS for better visualization of differences between drives.
The high level testing methodology remains unchanged from our S3700 review. Unlike in previous reviews however, I did vary the percentage of the drive that I filled/tested depending on the amount of spare area I was trying to simulate. The buttons are labeled with the advertised user capacity had the SSD vendor decided to use that specific amount of spare area. If you want to replicate this on your own all you need to do is create a partition smaller than the total capacity of the drive and leave the remaining space unused to simulate a larger amount of spare area. The partitioning step isn't absolutely necessary in every case but it's an easy way to make sure you never exceed your allocated spare area. It's a good idea to do this from the start (e.g. secure erase, partition, then install Windows), but if you are working backwards you can always create the spare area partition, format it to TRIM it, then delete the partition. Finally, this method of creating spare area works on the drives we've tested here but not all controllers may behave the same way.
The first set of graphs shows the performance data over the entire 2000 second test period. In these charts you'll notice an early period of very high performance followed by a sharp dropoff. What you're seeing in that case is the drive allocating new blocks from its spare area, then eventually using up all free blocks and having to perform a read-modify-write for all subsequent writes (write amplification goes up, performance goes down).
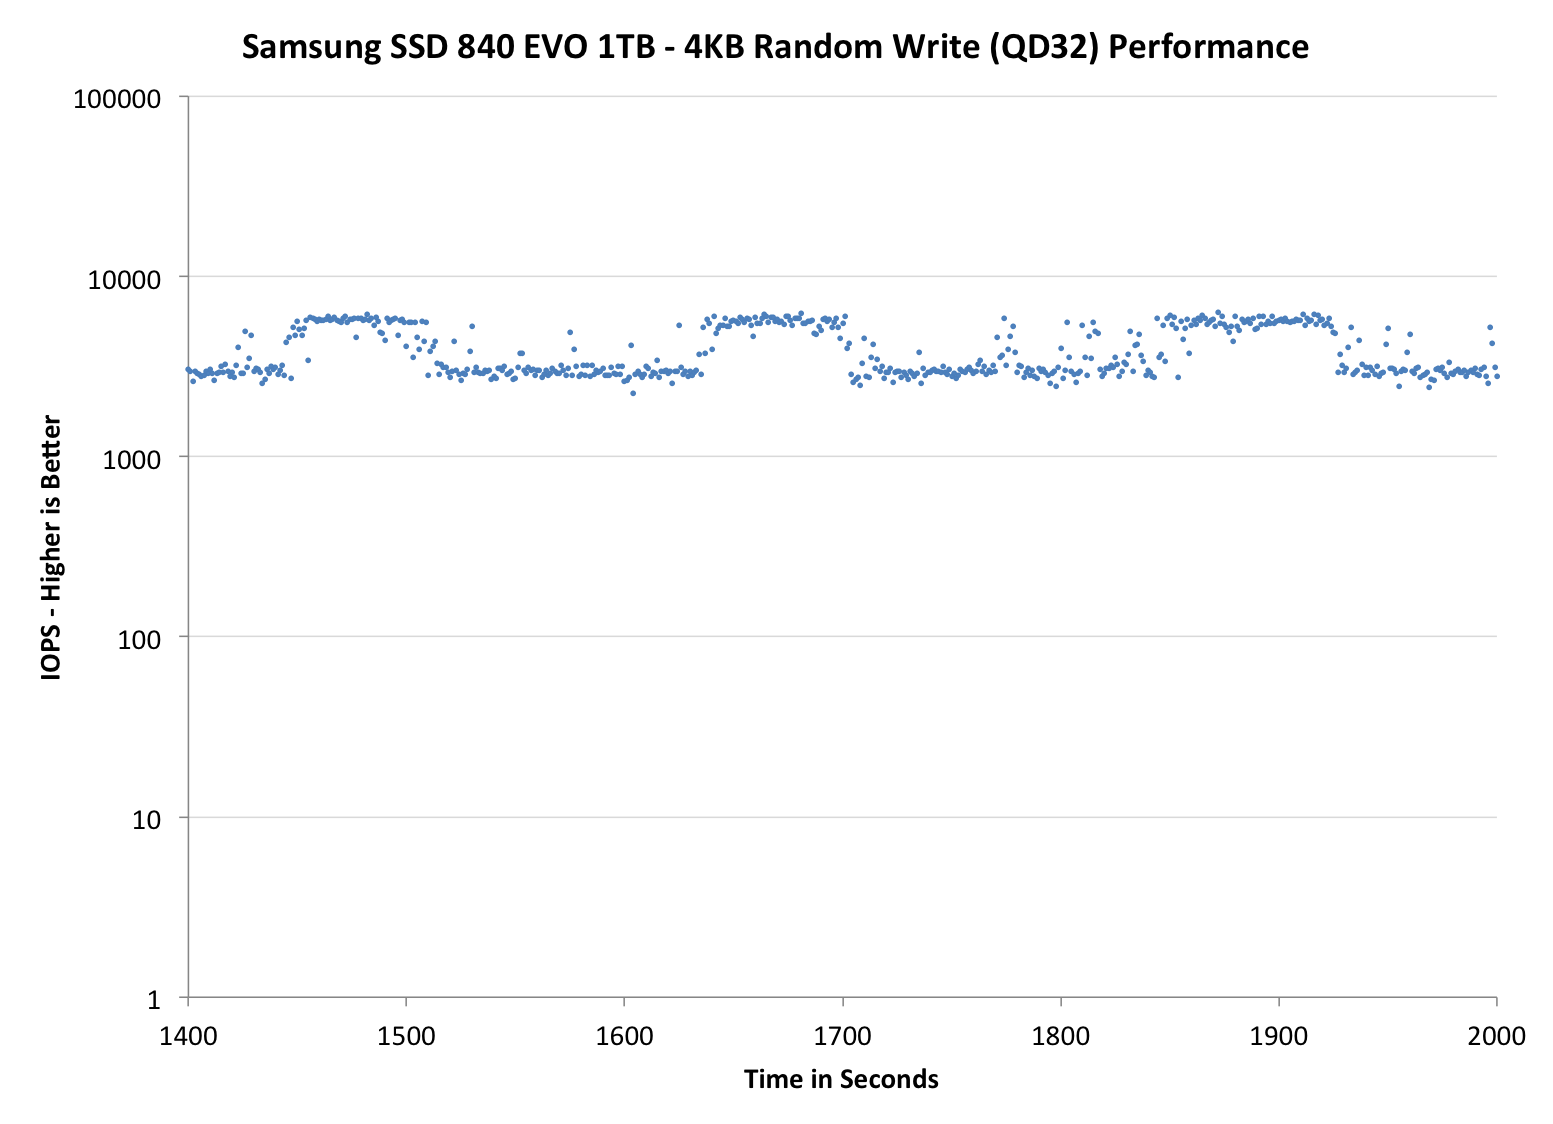
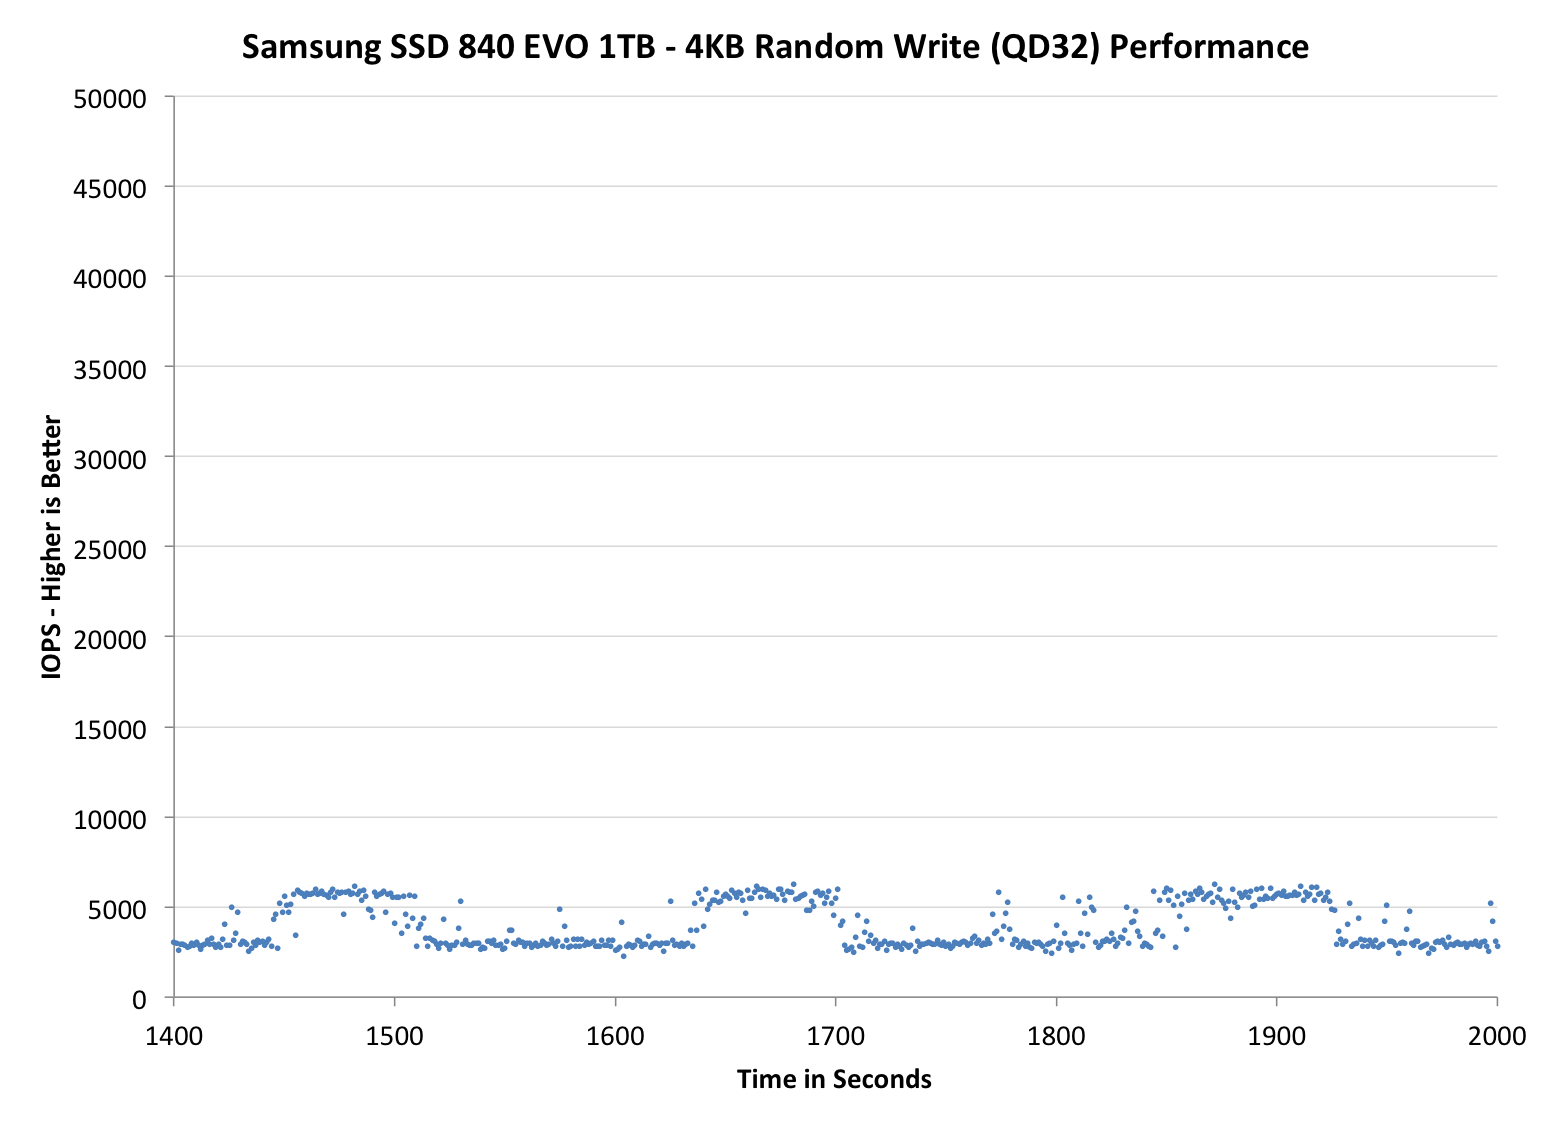
The second set of graphs zooms in to the beginning of steady state operation for the drive (t=1400s). The third set also looks at the beginning of steady state operation but on a linear performance scale. Click the buttons below each graph to switch source data.
 |
|||||||||
| Crucial M500 960GB | Samsung SSD 840 EVO 1TB | Samsung SSD 840 EVO 250GB | SanDisk Extreme II 480GB | Samsung SSD 840 Pro 256GB | |||||
| Default | |||||||||
Thanks to the EVO's higher default over provisioning, you actually get better consistency out of the EVO than the 840 Pro out of the box. Granted you can get similar behavior out of the Pro if you simply don't use all of the drive. The big comparison is against Crucial's M500, where the EVO does a bit better. SanDisk's Extreme II however remains the better performer from an IO consistency perspective.
 |
|||||||||
| Crucial M500 960GB | Samsung SSD 840 EVO 1TB | Samsung SSD 840 EVO 250GB | SanDisk Extreme II 480GB | Samsung SSD 840 Pro 256GB | |||||
| Default | |||||||||
 |
|||||||||
| Crucial M500 960GB | Samsung SSD 840 EVO 1TB | Samsung SSD 840 EVO 250GB | SanDisk Extreme II 480GB | Samsung SSD 840 Pro 256GB | |||||
| Default | |||||||||
Zooming in we see very controlled and frequent GC patterns on the 1TB drive, something we don't see in the 840 Pro. The 250GB drive looks a bit more like a clustered random distribution of IOs, but minimum performance is still much better than on the standard OP 840 Pro.
TRIM Validation
Our performance consistency test actually replaces our traditional TRIM test in terms of looking at worst case scenario performance, but I wanted to confirm that TRIM was functioning properly on the EVO so I dusted off our old test for another go. The test procedure remains unchanged: fill the drive with sequential data, run a 4KB random write test (QD32, 100% LBA range) for a period of time (30 minutes in this case) and use HDTach to visualize the impact on write performance:
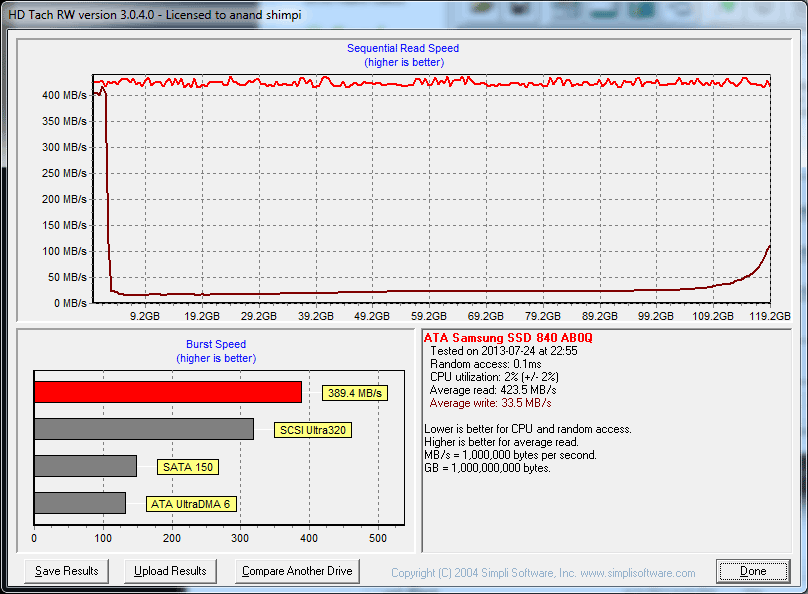
Minimum performance drops down to around 30MB/s, eugh. Although the EVO can be reasonably consistent, you'll still want to leave some free space on the drive to ensure that performance always stays high (I recommend 15 - 25% if possible).
A single TRIM pass (quick format under Windows 7) fully restores performance as expected:
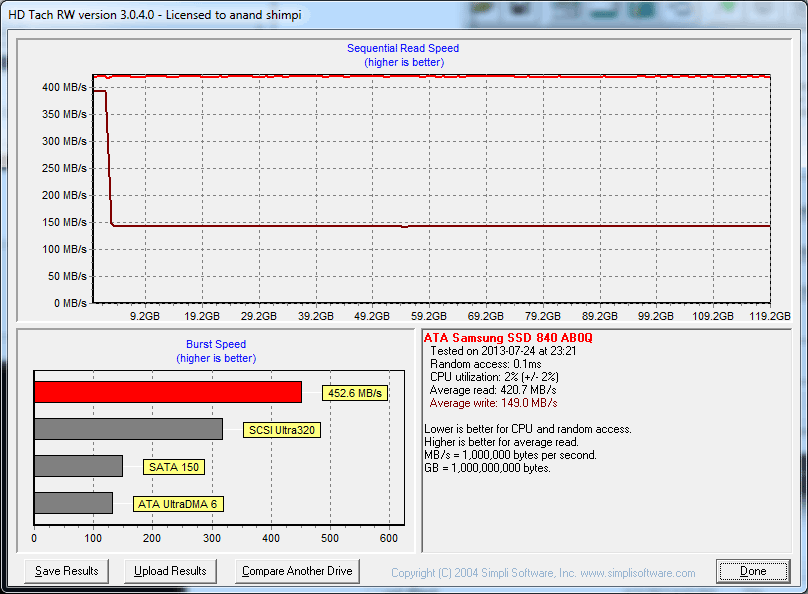
The short period of time at 400MB/s is just TurboWrite doing its thing.


137 Comments
View All Comments
ervinshiznit - Thursday, July 25, 2013 - link
Typo? On the Turbowrite page you say "For most light use cases I can see TurboWrite being a great way to deliver more of an MLC experience but on a TLC drive."It should be deliver more of a SLC experience but on a TLC drive.
ciri - Sunday, July 28, 2013 - link
SLC>MLC>TLCGuspaz - Thursday, July 25, 2013 - link
The fact that RAPID sees any performance improvement at all illustrates to me a failure of the operating system's disk caching subsystem. That's all that RAPID really is, after all, a replacement for the Windows disk cache.I'd be curious to see the performance results of RAPID compared to the disk caching subsystems on other platforms, such as Linux and ZFS (which even on Linux has it's own cache called the "ARC"). Are the large improvements because Windows disk caching is particularly bad, or because RAPID is a better implementation than anybody else?
themelon - Thursday, July 25, 2013 - link
Windows is absolutely horrible at filesystem caching and I don't think it does any sort of block caching. It seems to use more of a FIFO algorithm that has no sequential write bypass no matter what you do. ZFS and the 2 block device caches that recently integrated into the linux kernel, bcache and dm-cache, use more of an LRU method. All of them have at least basic sequential bypass detection as well. bcache in particular is tuneable to your load in almost all aspects of performance. Of course these are only block side caching and currently have no filesystem specific knowledge.There is some interesting work going on to track hot spots that will eventually allow for preemptive cache warming and/or hot relocation. Right now it is BTRFS specific but it is being integrated below the filesystem layer so any filesystem will eventually be able to take advantage of it.
ZFS on Linux is a waste of time in my opinion. ZFS's L2ARC and SLOG are great but limited by some of what I feel are architectural flaws in zfs itself. I used to love zfs but the Linux kernel block stack has caught up to it in features and still offers all of the flexibility that it always has.
aicom - Friday, July 26, 2013 - link
Windows' cache system is better than you give it credit for. It does support sequential bypass (see FILE_FLAG_SEQUENTIAL_SCAN flag). It works with filesystem drivers with the Cc* APIs in the kernel. It also supports caching files over a network, even with other clients modifying the files. It does standard read-ahead and write-behind and is supplemented by an adaptive prefetcher (SuperFetch).The reason we're seeing such huge gains is because the programs being tested explicitly ask NOT to be cached. The whole point is to test the drive, so they pass FILE_FLAG_NO_BUFFERING to disable caching on the files being accessed.
MrSpadge - Saturday, July 27, 2013 - link
Excellent post!Timur Born - Sunday, July 28, 2013 - link
Question still arises why the Anand Storage Bench is affected beneficial by RAPID?! Is it because ASB also asks the Windows cache to be bypassed, is it because of the Windows cache flushing parts of its pages every second or does RAPID communicate with the drive (firmware) at a more fundamental level that allows further optimizations?watersb - Friday, July 26, 2013 - link
Excellent points. I stick with ZFS because I trust it (after many hardware failures but no data loss) and because it is cross-platform.Mac HFS does "hot relocation", I believe. And NTFS has always tried to keep hot files in the middle of the disk in order to reduce hard disk seek times. So maybe I don't understand what is meant by hot relocation.
piroroadkill - Thursday, July 25, 2013 - link
I agree. I'm pretty sure Windows' own disk caching is terrible. It's pretty poor even on the server side. They really need to work on that shit.tincmulc - Thursday, July 25, 2013 - link
How is rapid any better from SuperCache or FancyCache? Not only do they do the same thing, but can also be configured to use more ram or use os invisble memory (32 bit os with more than 3GB of ram) and they work for any drive, even HDDs.