Dell U3014 LCD Review
by Chris Heinonen on April 15, 2013 2:00 PM ESTOnce we get into high-end monitors, display uniformity becomes more and more important. If you’re doing serious graphics work then you need to have one side of the display look like the other for doing comparisons. If two images look different because of the display then doing work becomes harder. Previous models that I’ve seen with high end uniformity control, like the NEC PA271W, have been thick beasts as they try to control temperature and everything else to preserve that uniformity. The Dell is much thinner but that could be due to the GB-LEDs and not using a CCFL backlight.
Dell also features Uniformity Compensation on the U3014, which was a feature I was excited to see. However, I’m tempering my excitement because it unfortunately has a number of restrictions. First, it can’t be used in the sRGB, AdobeRGB, or CAL1/2 modes. Second, when using it in the Standard mode, your brightness is locked at 50. On the NEC, once you pushed past a certain level (right around 250 cd/m2) it would tell you that uniformity can no longer be controlled, but it still allowed you to adjust the brightness level. If you are concerned about uniformity then you’re probably concerned about color first, so it makes no sense to have a uniformity mode that can’t help with both.
I did quickly measure the display with uniformity enabled in Standard mode, and it is very uniform in brightness. It ranges from 240-247 cd/m2 across the display, which is about as good as you can get. However, it also means you are stuck with the less-accurate colors and grayscale by default, and that you can’t adjust the brightness level as 247 cd/m2 is really quite bright. This makes it even more upsetting that Dell only has this mode in a very restricted use scenario, since it seems to perform great.
Dell also is the first display I’ve seen that ships with a calibration report that displays the uniformity of the screen, both in brightness and in dE levels. To see how close they get, I used CalMAN again as they have a new uniformity tool that provides a lot of data. I used 25 points to match the reporting that Dell provided me, so I can see how accurate the report is. Unfortunately CalMAN isn’t totally finished so all I can report on is the average dE2000 for each zone and not the dE2000 compared to the center, which is actually what I want to know. You can have the same dE2000 in two zones but with totally different errors, so they’ll look nothing alike. CalMAN can display this data on screen, and so I’ve created a couple of galleries for it, but the export of this data isn’t there yet.
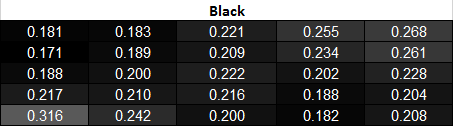
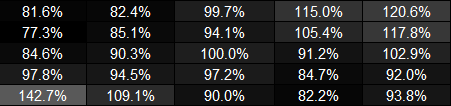
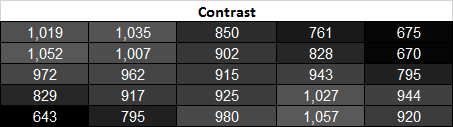
Checking our grayscale uniformity, we actually see a really good result overall. Using the center point as a reference, we drop down to 88.5% brightness on the far left edge and 86.2% on the far right edge, but otherwise we are at 95% or higher over most of the screen. Keeping the brightness in the range of 190-200 cd/m2 over that much of the screen is very good and better than most displays out there. The black level isn’t quite as good, as there are a couple of bright corners, especially in the lower-left, that I would prefer to not see. However, these result in a contrast ratio around the screen that ranges from 643 in that bright corner up to 1057, with the median being 920:1. Dell specifies 1000:1 and that would have been hit pre-calibration, but we had to reduce the contrast a little because of the white clipping at the very top.
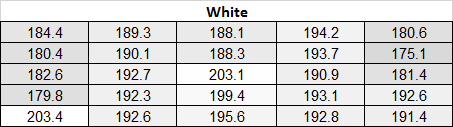
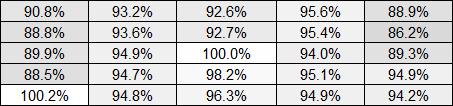
The CalMAN charts here for Grayscale show you readings around the screen for 0%, 20%, 40%, 60%, 80%, and 100%. You can see the dE2000 for each zone compared to the center zone, and the dE2000 compared to each surrounding zone. This is the best way to measure this and what we will use as soon as CalMAN lets us export the data correctly. You can see that once we get to 100% White, some zones have an error up to dE2000 4.6 compared to the center, while their actual dE2000 number is only 2.50 to the reference target. This helps validate why this method works so much better, as the actual difference on-screen will be 4.6, but if you just measure each zone independently you would see a peak error of 2.50 and assume that’s the worst case scenario.
One thing to note about these charts is to ignore the data in the lower-right square. I failed to change this to the secondary display when running this test, which doesn’t affect anything except the Windows 8 “Activate Windows” icon was visible in the lower-right corner, causing incorrect readings. All the other data is fine, but this data doesn’t save like all the other data so it’s impractical to re-run everything again to fix that one square. The White and Black level readings were done again to make sure they’re correct, but the dE2000 number is wrong.


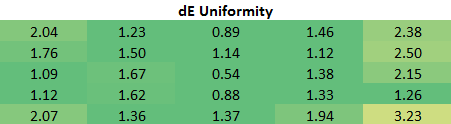
After all of that with the grayscale, how does the color checker test perform? With the same caveats about the data as with the Grayscale, the highest dE2000 in any zone after calibration is 2.74, which is still very good. Only 3 of the 25 zones are above a dE2000 average of 2.0, so overall all the areas look good independent of each other. As with the Grayscale, we have some of the data from the uniformity testing in CalMAN in a gallery. 6 of the 24 samples in the Color Checker test are grayscale, so I’ve added six more colors here so you can see how it performs. Overall the errors compared to center are quite good, with the highest errors in the lower-left corner that suffers from some light bleed. Overall the U3014 is very good with its uniformity, though not perfect. I just wish the uniformity compensation worked in all modes, but the limitations on it make it paractially cuseless for most people interested in such a feature.


84 Comments
View All Comments
chazh - Friday, April 26, 2013 - link
i am a new about this.actually, what is the parameter for being a good monitor especially for gaming ?
to be honest, this monitor prices looks expensive. Now, i am using the Asus MX279H with a triple setup. So far, i really satisfied with the result.
yslee - Saturday, April 27, 2013 - link
Hmm, no word on how the anti-glare coat is like on this version? I have the 3008 WFP and the coat interferes a little on white backgrounds. It's not extremely annoying, but I'd like to see an improvement here regardless.secretmanofagent - Sunday, April 28, 2013 - link
How is the antiglare coating? The U2412M's coating drives me nuts.masotime - Friday, May 17, 2013 - link
Did anyone actually bother to test this against a MacBook / OSX? There's this bizzare oversharpening effect that is produced by this monitor - turning the "Sharpness" down to 0 still leaves some weird distortion. In addition, the colours look all wrong when the output is displayed from OSX - regardless of how much tweaking of the colour profiles I attempt.