The Crucial/Micron M500 Review (960GB, 480GB, 240GB, 120GB)
by Anand Lal Shimpi on April 9, 2013 9:59 AM ESTRandom Read/Write Speed
The four corners of SSD performance are as follows: random read, random write, sequential read and sequential write speed. Random accesses are generally small in size, while sequential accesses tend to be larger and thus we have the four Iometer tests we use in all of our reviews.
Our first test writes 4KB in a completely random pattern over an 8GB space of the drive to simulate the sort of random access that you'd see on an OS drive (even this is more stressful than a normal desktop user would see). I perform three concurrent IOs and run the test for 3 minutes. The results reported are in average MB/s over the entire time. We use both standard pseudo randomly generated data for each write as well as fully random data to show you both the maximum and minimum performance offered by SandForce based drives in these tests. The average performance of SF drives will likely be somewhere in between the two values for each drive you see in the graphs. For an understanding of why this matters, read our original SandForce article.
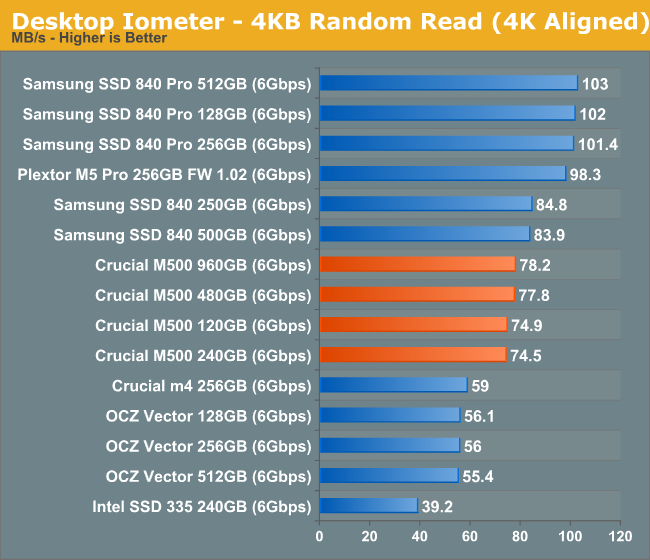
Random read performance starts out quite nicely. There's a good improvement over the old m4 and the M500 lineup finds itself hot on the heels of the Samsung SSD 840. There's not much variance between the various capacities here.
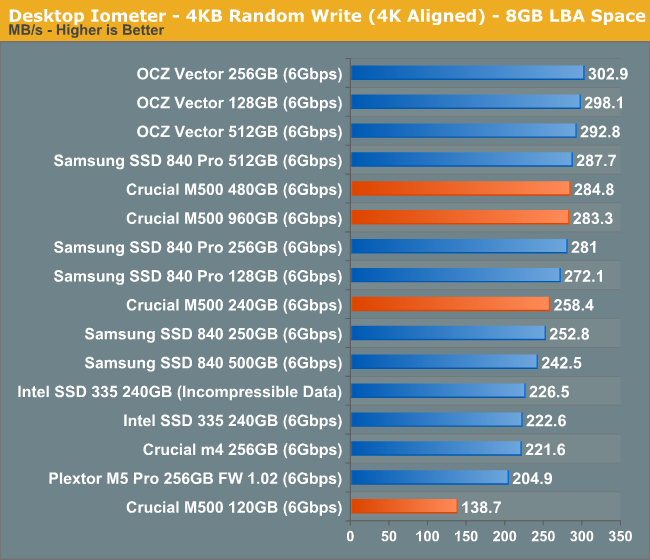
It's with the random write performance that we get some insight into how write parallelism works on the M500. The 480GB and 960GB drives deliver roughly the same performance, so all you really need to saturate the 9187 is 32 NAND die. The 240GB sees a slight drop in performance, but the 120GB version with only 8 NAND die sees the biggest performance drop. This is exactly why we don't see a 64GB M500 at launch using 128Gbit die.
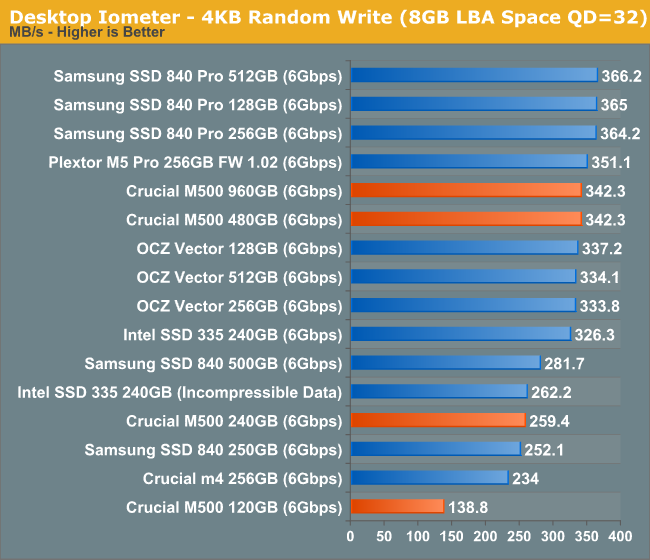
Ramping up queue depth causes some extra scaling on the 32/64 die drives, but the 240GB and 120GB parts are already at their limits. There physically aren't enough NAND die to see any tangible gains in performance between high and low queue depths here on the smaller drives. This is going to be a problem that everyone will have to deal with ultimately, the M500 just encounters it first.
Sequential Read/Write Speed
To measure sequential performance I ran a 1 minute long 128KB sequential test over the entire span of the drive at a queue depth of 1. The results reported are in average MB/s over the entire test length.
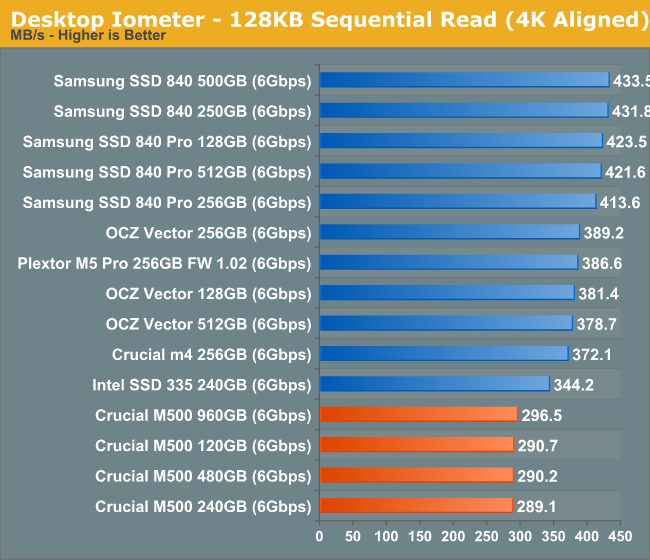
Low queue depth sequential read performance looks ok but the M500 is definitely not class leading here.
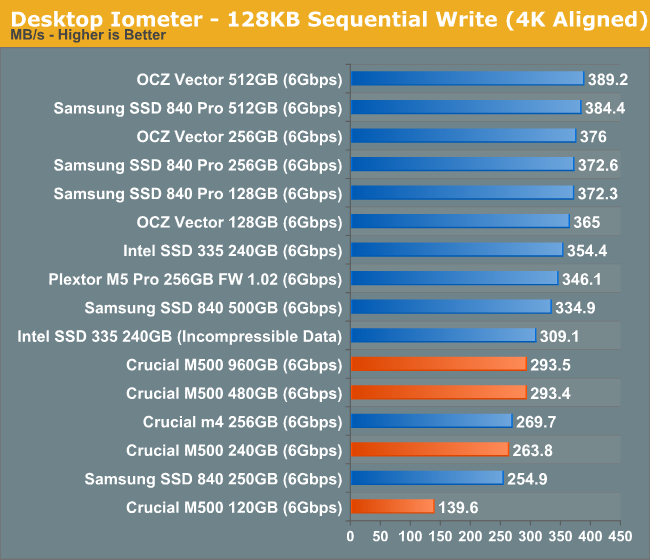
There's pretty much the same story when we look at sequential writes, although once again the 120GB M500 shows its limits very openly. The 840 and M500 have similar performance levels at the same capacity point, but the M500 is significantly behind the higher end offerings as you'd expect.
AS-SSD Incompressible Sequential Read/Write Performance
The AS-SSD sequential benchmark uses incompressible data for all of its transfers. The result is a pretty big reduction in sequential write speed on SandForce based controllers.
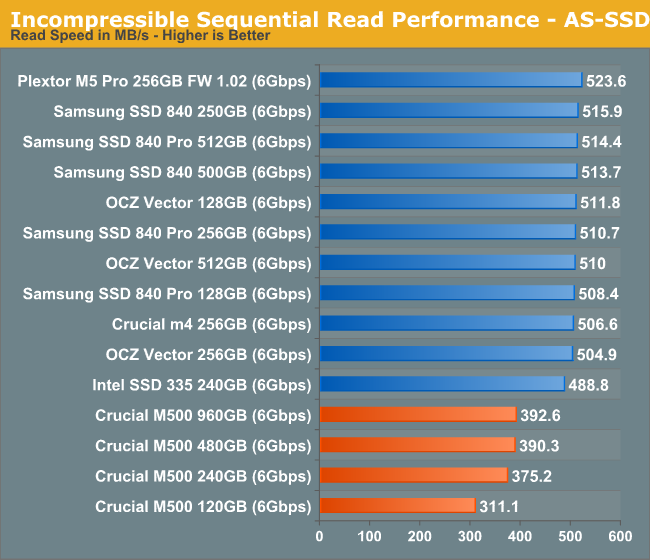
Ramping up queue depth we see a substantial increase in sequential read performance, but there's still a big delta between the M500 and all of the earlier drives.
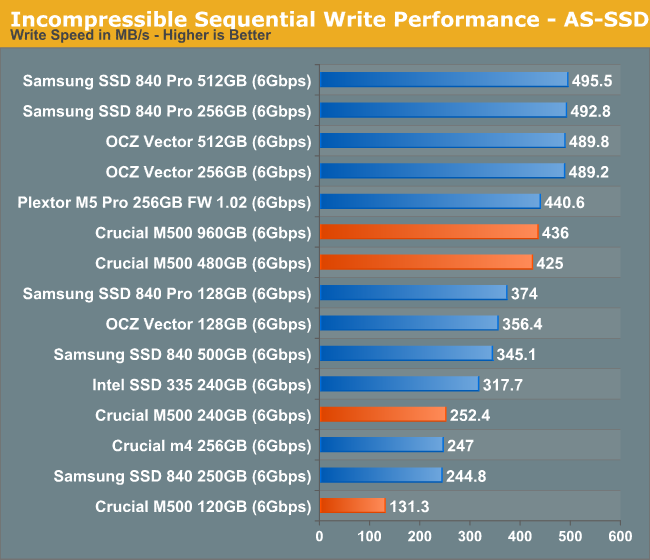
The high-queue depth sequential write story is a bit better for the M500. It's tangibly quicker than the 840 here.


111 Comments
View All Comments
RU482 - Tuesday, April 9, 2013 - link
I have had an M500 mSATA 120GB running Anvil Storage Utilities for a couple weeks now. Like the Intel 535 30GB and 240GB, the M500 120GB is slower and runs hotter than Sandisk 64GB X100 and x110 evals I'm also testingteiglin - Tuesday, April 9, 2013 - link
How long would it take to run the Destroyer on a HDD? Or is that too depressing to consider? :)andrew-1983 - Tuesday, April 9, 2013 - link
The AS-SSD incompressible sequential read numbers seem rather low, in other reviews it's around 490MB/s, not 390, both for the 960GB and the 480GB size. Or am I missing something?philipma1957 - Tuesday, April 9, 2013 - link
I am waiting on my 960gb an amazon preorder. I will build a mac mini fusion with the 1tb hgst 7200 rpm hdd. my quad 2.3 mini will also have 16gb ram kingston plug n play.philipma1957 - Wednesday, April 17, 2013 - link
all my gear came on tues I set up the mini and it now has a 1.96tb fusion drive. very nice machine with a very nice ssd.danielmorris - Tuesday, April 9, 2013 - link
Once you get the new destroyer benchmark done and most of the ssds run through it, I think it would be interesting to run an hdd or two through it. It might take a week or two but it would encourage us who still have an hdd to get an ssd.praftman - Wednesday, April 10, 2013 - link
Recently the MyDigitalSSD was reviewed and it was mentioned a 960GB varient was undergoing review. Here we see:"...the M500 is really the only game in town. ...a good, high-capacity SSD for notebook use and based on my options today, I'd have no issues going with the 960GB M500."
...So does that mean that the MyDigitalSSD 960GB is looking not up to par? At only $800 and with better Idle power consumption it was my first choice.
Also, it is my understanding from the article that the lower Idle figures Micron claims are entirely dependent on these next-gen Haswell laptops and I should see no such difference from your reported ~1w with my 2012 MBP...correct?
praftman - Friday, April 12, 2013 - link
?mayankleoboy1 - Wednesday, April 10, 2013 - link
in the Destroyer test, even with so many tasks, the average QD is ~5.5 .That means that for the average desktop usage, the QD is around 1. We need more tests that simulate such low QD usage.
Also, I am curious why are you testing consumer SSD's with a workload that is atleast two orders of magnitude more intensive than what people actually use. Basically, you are testing a client SSD with a Server workload. I dont see what it tests.
What is the use-case of testing such loads on a desktop SSD ?
Tjalve - Wednesday, April 10, 2013 - link
I agree. Thats why ive done some benchmarking of "real world scenarios". I actually recorded HDD activity from three diffrent people who use there computer for three entirley diffrent reasons. One beeing a gamer, one beeing one of the people at the office where I work (outlook, word, powerpoint,firefox) and the last one is recorded from a friend of mine who is a freelance video editor. So the last trace is based on him editing and compiling videos.http://www.nordichardware.se/SSD-Recensioner/svens...
http://www.nordichardware.se/SSD-Recensioner/svens...
http://www.nordichardware.se/SSD-Recensioner/svens...