AMD Comments on GPU Stuttering, Offers Driver Roadmap & Perspective on Benchmarking
by Ryan Smith on March 26, 2013 2:28 AM ESTThe Start: The Rendering Pipeline In Detail
Before we can even discuss the concept of stuttering and other frame timing anomalies, we need to first take a look at a high-level overview of the Windows rendering pipeline. The pipeline isn’t particularly complex, but understanding where various stages of the process are in the hands of Windows, the CPU, the driver, and the video card is necessary to understand where bottlenecks and delays can occur.
At its most fundamental level, rendering a frame is a 3 part process. An application needs to pass data to Windows, Windows needs to manage the process and interface with the drivers, and finally once Windows and driver preparation is complete, a frame can be passed off to the GPU for final rendering and display.
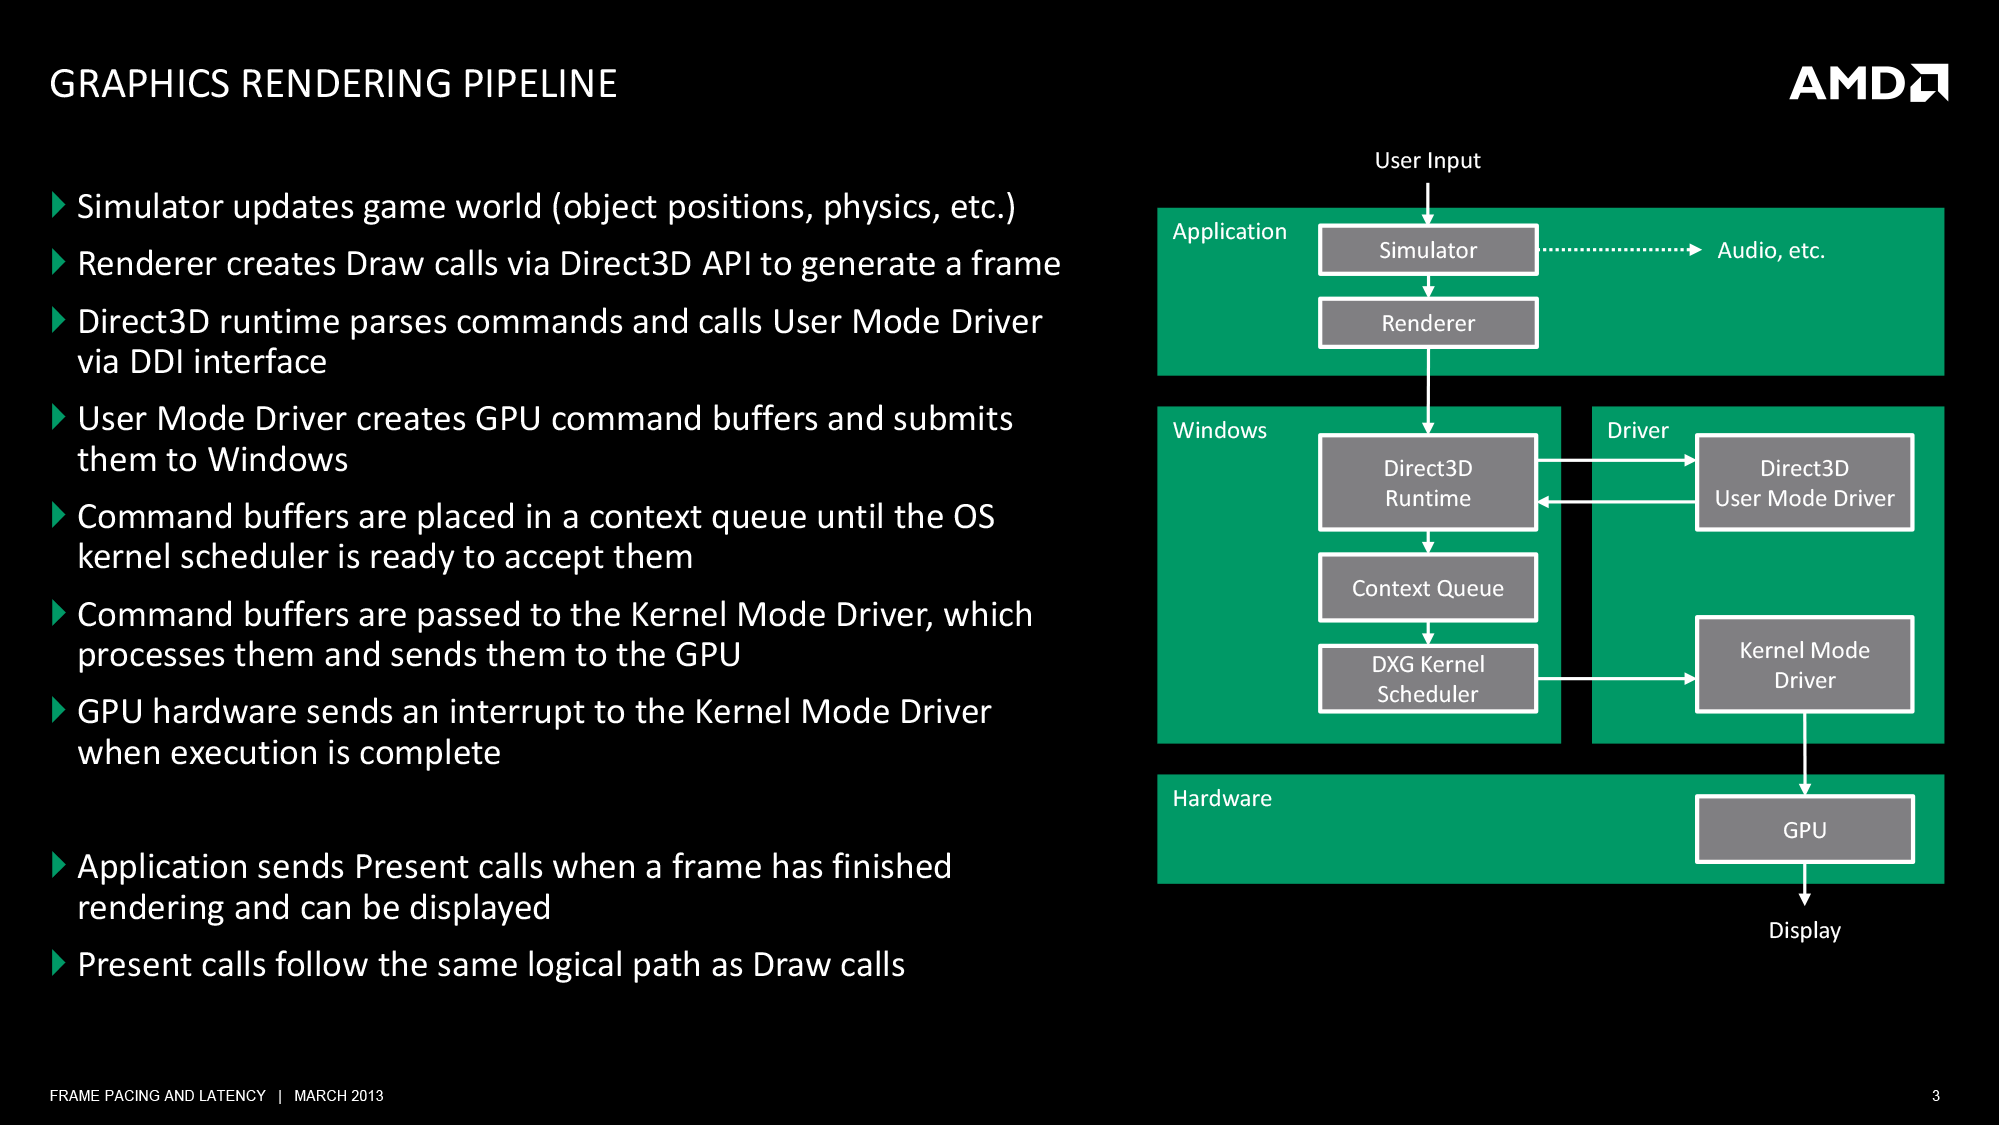
At the top of the chain is the application itself. This is where user input is being handled and where in the context of a game the simulation is being executed. From a technical perspective, it is the application that is the first arbitrator for game smoothness; applications are responsible for adjusting the simulation rate in order to keep the flow of frames smooth. If the application cannot ensure an even rate, then nothing else that follows will really matter.
The reality of course is that this is harder than it sounds. It is not an insurmountable problem, but PCs are devices with a wide spectrum of performance and capabilities. A dual-core processor with an iGPU performs very different from a hex-core processor with a small army of GPUs, and an application needs to be able to accommodate this so that the simulation operates as evenly as possible in both CPU and GPU-bottlenecked scenarios.
Ultimately any timing model is going to be reactive, adjusting itself in response to prior events and how long previous frames took to render. Though another option is to shortcut this process entirely and operate at a fixed (or capped) simulation rate, either basing a game around 30Hz/60Hz operation, or decoupling rendering from the simulation entirely. Anyone who has uncapped id Software’s Rage for example will find that the game simply does not behave correctly without its 60Hz cap.
Static or dynamic, once a simulation has a suitable timing model in place we can then begin to look further down the chain, which is where we first encounter Direct3D, Windows’ primary 3D rendering API. Direct3D is nothing short of an enormous, complex structure of API calls and features. We tend to reduce it to version numbers and marque features for the sanity of ourselves and our readers – as we will here – but it goes without saying that Direct3D takes years to master; and for a GPU manufacturer it’s made all the more complex by the simultaneous existence of the modern iteration of Direct3D (DX10+), and the classic iteration that is DX9 and its predecessors.
For the purpose of the rendering pipeline Direct3D has a few different jobs. First and foremost, it is collecting draw calls from the application, combining them, and processing them for further work. Once a complete frame’s worth of draw calls has been collected, Direct3D passes its processed work over to the first component of the video card driver stack, the User Mode Driver (UMD).
It’s the UMD that is primarily responsible for taking the output of Direct3D and turning it into work batches the GPU can handle. These work batches, command buffers (aka Display Lists), are collections of instructions and data suitable for processing by the target GPU. Among other things, the UMD is responsible for shader compilation and assigning rendering elements to the correct (and best) surface formats for the GPU.
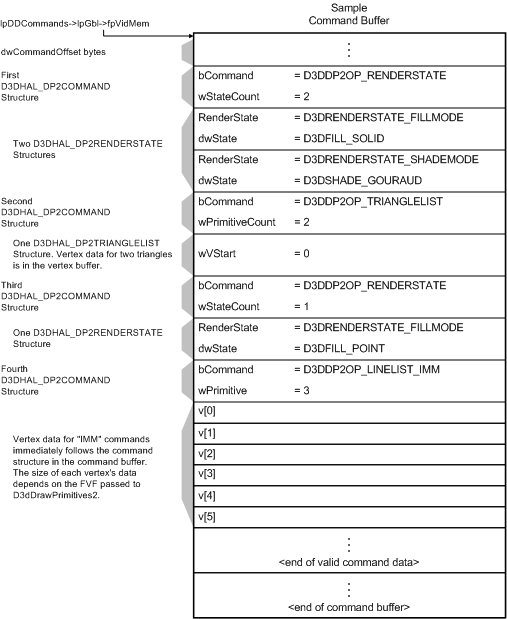
A logical view of single command buffer; from Microsoft's Direct3D documentation
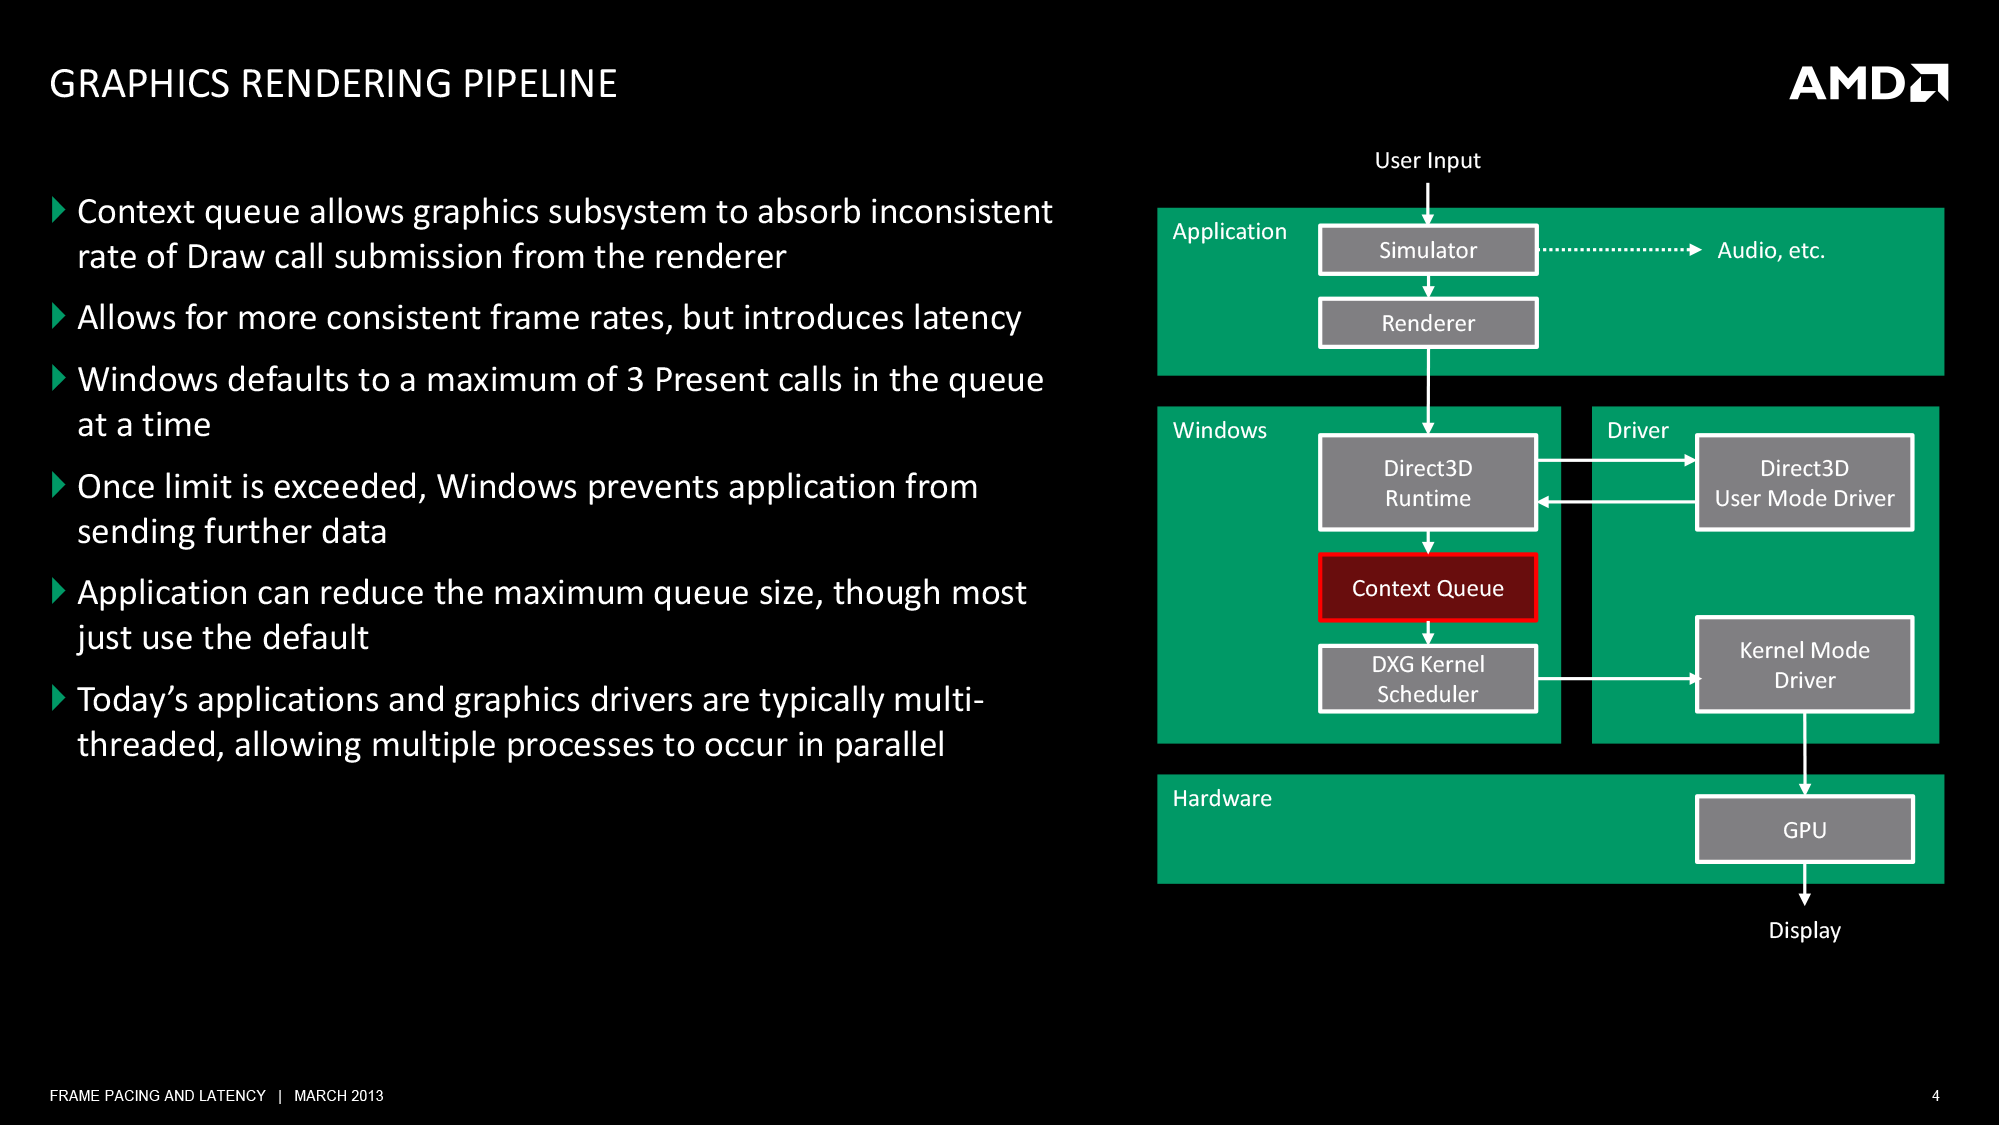
When the UMD’s work is complete, it passes its command buffer back over to Direct3D. Direct3D in turn passes that command buffer to the context queue, our first real bottleneck. We’ll get back to why this is a bottleneck in a bit, but briefly, the context queue is responsible for queuing the individual command buffers in order to smooth out the rendering process. Queuing command buffers at this stage increases frame rendering latency, but by providing a buffer of buffers it allows the rendering pipeline to absorb any variances in rendering time or simulation time to more smoothly render frames.
The context queue has also gone by other names over the years, such as the flip queue and the pre-rendered frames queue. This is the source of the 3 frame render-ahead limit in Windows that is sometimes exposed in games and drivers, as Windows will by default queue up to 3 frames in this manner. This can be controlled by application developers, but most will leave it at 3 so long as a game is smoothly moving along.
Beyond the context queue we have Windows’ GPU scheduler, which is what regulates the popping of command buffers off of the context queue to be fed to the kernel mode GPU driver (KMD). Beyond this point the rest of the pipeline is rather simple, with the KMD taking the command buffer and feeding it to the GPU, all the while the KMD and GPU work together to manage the operation of the GPU. When a frame is finally completed, the GPU generates an interrupt to inform the KMD and OS about the completion.
At the end of this process we have a rendered frame sitting in the GPU’s back-buffer, but the frame itself is not displayed automatically. At the end of a batch of command buffers – effectively making the beginning and ends of frames – is the Direct3D Present() call. Present is the command that is responsible for telling the GPU to flip the back buffer to the front and to present the rendered frame to the user. Only once the Present call executes does a frame get displayed. The Present call, though not a command buffer object, still follows the same rendering path as the command buffers, including queuing up in the Context Queue.


103 Comments
View All Comments
Juddog - Tuesday, March 26, 2013 - link
What the hell you talking about? Network latency is an entirely different subject.Juddog - Tuesday, March 26, 2013 - link
I had meant the above as a reply to the guy talking about network fragmentation; I'm not sure why the reply in the new format doesn't auto-nest the response.danielkza - Tuesday, March 26, 2013 - link
Because then the measurement wouldn't be representative of the performance users will actually see?polaco - Tuesday, March 26, 2013 - link
Thanks a lot for this interesting article. Is astonishing to see how minimal software issues can severely degrade performance and efforts done in other areas, turning a company less competitive with the money losses this takes with it.Also is a reminder of how important is to implement deep quality and performance evaluations in software development. Is a shame that in today software industry the delivery dates are more important than quality many times and programmers end up delivering half baked applications from also half baked requirements.
Thanks again.
sudz - Tuesday, March 26, 2013 - link
Good to know I'm not going crazy. Almost every game I play has a decent frame rate, but still doesn't seem smooth. (Gigabyte Windforce 6850 OC) Tried underclocking, overclocking, Different PC's... I thought I had a dud card.DemBones79 - Tuesday, March 26, 2013 - link
Reading through the whole article, I became increasingly convinced that it's not that FRAPS is necessarily a bad tool for measuring this, but that people need guidance in how to interpret the graphs correctly.The first time I saw a frame latency (or whatever you're calling them now) graph, my first impression wasn't, "Wow, look at all these little latency spikes." It was, "Holy sh*t! Look at those huge freaking spikes!" It was a simple matter of severity. I think anyone can take a look at the "heartbeat", see that it is a recurring pattern with a relatively consistent frequency, and- while they may not be able to say for certain if it is indicative of a problem- they can say that it is "normal" for that particular card. It's the huge spikes, the ones that aren't occurring at consistent intervals, that are so much more severe than the "heartbeat", that are the issue.
How hard would it be for a reviewer to draw a pair of horizontal lines across the graph to indicate the limits of "normal" stuttering, where anything beyond the lines in either direction would be considered "abnormal"? A method of separating the signal from the noise.
Furthermore, I thought it was reviewers noticing a difference- that framerate alone couldn't explain- in the way games played between ATI and NVIDIA that prompted the whole investigation into latency. Several sections in the article mention how FRAPS results may not be indicative of user experience. But it was user experience that prompted using FRAPS to try and explain what was being observed.
JPForums - Tuesday, March 26, 2013 - link
Thre are two things you need to keep in mind:1) Nvidia also agrees with the limitation of FRAPS. In fact, IIRC they were the first to voice the issue that FRAPS recordings are in the wrong place and can only infer what actually needs to be recorded. The author is correct, when Ati and Nvidia agree, we should at least pay attention.
2) Though your your points are AFAIK correct and well articulated, they still point to the issue of FRAPS inferring, rather than recording the the targeted information. The difference is, rather than consistency of output frames, you are looking for consistency of simulation steps. I agree that this is a metric that really needs to be covered. In fact, I would even go as far as matching simulation steps to their corresponding frame times to expose issues when short steps are accompanied by long frames or vice versa.
Unfortunately, FRAPS can't measure any of this directly and even for your points proves to be limited to inference. That said, until a reviewer gets tools that can reveal this information, inference via FRAPS is better than no information at all. Pcperspective's comments on AMD's stuttering issues are related (as they state) to crossfire setups. I could see the differences between CF and SLI in blind tests (though SLI also has some microstutter) and this only confirms it. The runt frames only add fuel to the fire. I'm open to using AMD in single GPU builds, but only use Nvidia for multiGPU builds. Perhaps this will change in July, but I'm guessing there will still be plenty of work to do.
hero1 - Tuesday, March 26, 2013 - link
Long time reader first timer commentor. I really liked this article, and have liked most of the articles here. What I want to say is, I hope that AMD fixes their drivers and address both single and dual gpu issues. I personally didn't have any stuttering when I had 2x7970s but they sometimes lost the link to each other and my system would only see one. I switched to the Titan since I got it for a reasonable price. Now this articles makes me wonder whether I should go back and grab the 2x7970s and save some cash in hopping that AMD has the mutliple GPUs issue solved by early summer. It's good to see them working to address the issue and hope we never have to encounter this again once it's done with. Next step should be how their mutli gpu solutions scale. Thanks Ryan and keep up the good work.Hrel - Tuesday, March 26, 2013 - link
That was a good breakdown of Direct3D. I'd like to see another one for OpenGL if we could. A side by side comparison would be nice.