3DMark for Windows Launches; We Test It with Various Laptops
by Jarred Walton on February 5, 2013 5:00 AM ESTInitial 3DMark Notebook Results
While we don’t normally run 3DMark for our CPU and GPU reviews, we do like to run the tests for our system and notebook reviews. The reason is simple: we don’t usually have long-term access to these systems, so in six months or a year when we update benchmarks we don’t have the option to go back and retest a bunch of hardware to provide current results. That’s not the case on desktop CPUs and GPUs, which explains the seeming discrepancy. 3DMark has been and will always be a synthetic graphics benchmark, which means the results are not representative of true gaming performance; instead, the results are a ballpark estimate of gaming potential, and as such they will correlate well with some titles and not so well with others. This is the reason we benchmark multiple games—not to mention mixing up our gaming suite means that driver teams have to do work for the games people actually play and not just the benchmarks.
The short story here (TL;DR) is that just as Batman: Arkham City, Elder Scrolls: Skyrim, and Far Cry 3 have differing requirements and performance characteristics, 3DMark results can’t tell you exactly how every game will run—the only thing that will tell you how game X truly scales across various platforms is of course to specifically benchmark game X. I’m also more than a little curious to see how performance will change over the coming months as 3DMark and the various GPU drivers are updated, so with version 1.00 and current drivers in hand I ran the benchmarks on a selection of laptops along with my own gaming desktop.
I tried to include the last two generations of hardware, with a variety of AMD, Intel, and NVIDIA hardware. Unfortunately, there's only so much I can do in a single day, and right now I don't have any high-end mobile NVIDIA GPUs available. Here’s the short rundown of what I tested:
| System Details for Initial 3DMark Results | |||
| System | CPU (Clocks) |
GPU (Core/RAM Clocks) |
RAM (Timings) |
| Gaming Desktop |
Intel Core i7-965X 4x3.64GHz (no Turbo) |
HD 7950 3GB 900/5000MHz |
6x2GB DDR2-800 675MHz@9-9-9-24-2T |
| Alienware M17x R4 |
Intel Core i7-3720QM 4x2.6-3.6GHz |
HD 7970M 2GB 850/4800MHz |
2GB+4GB DDR3-1600 800MHz@11-11-11-28-1T |
| AMD Llano |
AMD A8-3500M 4x1.5-2.4GHz |
HD 6620G 444MHz |
2x2GB DDR3-1333 673MHz@9-9-9-24 |
| AMD Trinity |
AMD A10-4600M 4x2.3-3.2GHz |
HD 7660G 686MHz |
2x2GB DDR3-1600 800MHz@11-11-12-28 |
| ASUS N56V |
Intel Core i7-3720QM 4x2.6-3.6GHz |
GT 630M 2GB 800/1800MHz HD 4000@1.25GHz |
2x4GB DDR3-1600 800MHz@11-11-11-28-1T |
| ASUS UX51VZ |
Intel Core i7-3612QM 4x2.1-3.1GHz |
GT 650M 2GB 745-835/4000MHz |
2x4GB DDR3-1600 800MHz@11-11-11-28-1T |
| Dell E6430s |
Intel Core i5-3360M 2x2.8-3.5GHz |
HD 4000@1.2GHz |
2GB+4GB DDR3-1600 800MHz@11-11-11-28-1T |
| Dell XPS 12 |
Intel Core i7-3517U 2x1.9-3.0GHz |
HD 4000@1.15GHz |
2x4GB DDR3-1333 667MHz@9-9-9-24-1T |
| MSI GX60 |
AMD A10-4600M 4x2.3-3.2GHz |
HD 7970M 2GB 850/4800MHz |
2x4GB DDR3-1600 800MHz@11-11-12-28 |
| Samsung NP355V4C |
AMD A10-4600M 4x2.3-3.2GHz |
HD 7670M 1GB 600/1800MHz HD 7660G 686MHz (Dual Graphics) |
2GB+4GB DDR3-1600 800MHz@11-11-11-28 |
| Sony VAIO C |
Intel Core i5-2410M 2x2.3-2.9GHz |
HD 3000@1.2GHz |
2x2GB DDR3-1333 666MHz@9-9-9-24-1T |
Just a quick note on the above laptops is that I did run several overlapping results (e.g. HD 4000 with dual-core, quad-core, and ULV; A10-4600M with several dGPU options), but I’ve taken the best result on items like the quad-core HD 4000 and Trinity iGPU. The Samsung laptop also deserves special mention as it supports AMD Dual Graphics with HD 7660G and 7670M; my last encounter with Dual Graphics was on the Llano prototype, and things didn’t go so well. 3DMark is so new that I wouldn’t expect optimal performance, but I figured I’d give it a shot. Obviously, some of the laptops in the above list haven’t received a complete review, and in most cases those reviews are in progress.
And with that out of the way, here are the results. I’ll start with the Ice Storm tests, followed by Cloud Gate and then Fire Strike.
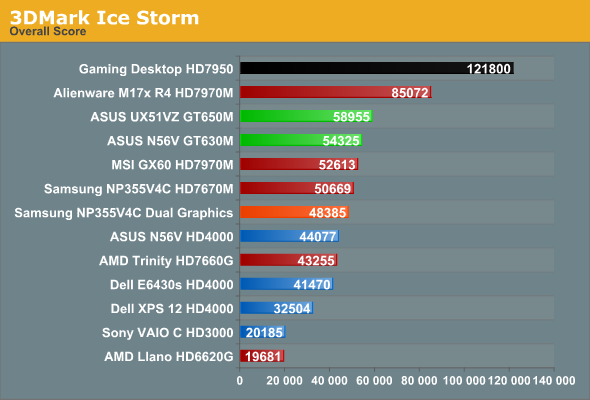
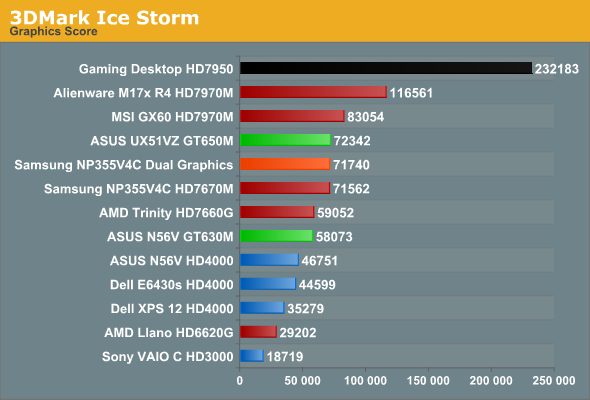
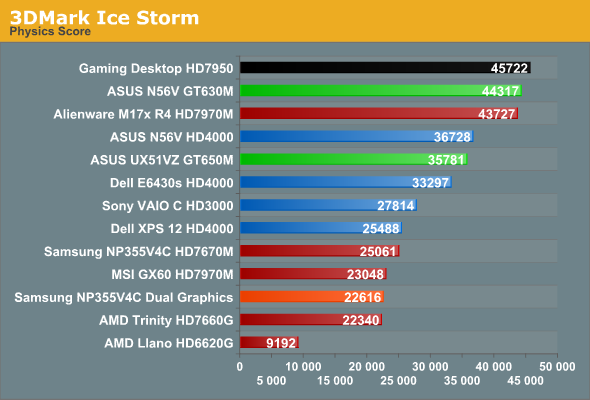
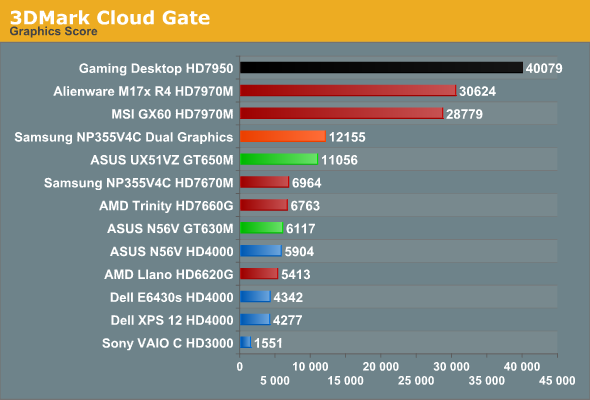
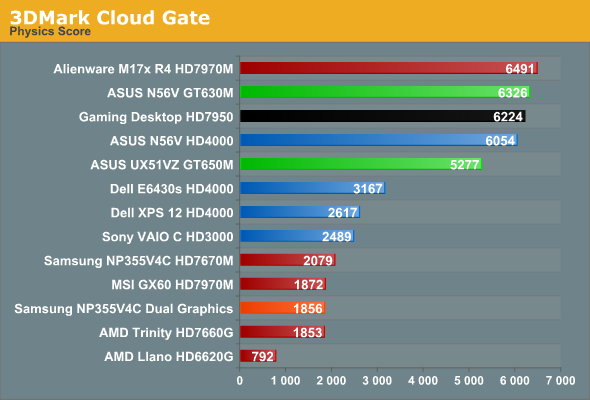
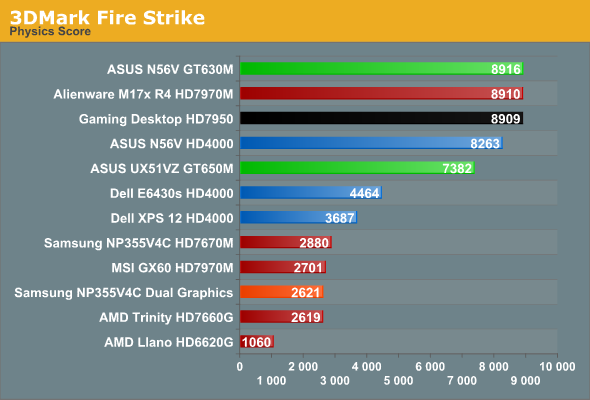
As expected, the desktop typically outpaces everything else, but the margins are a bit closer than what I experience in terms of actual gaming. Generally speaking, even with an older Bloomfield CPU, the desktop HD 7950 is around 30-60% faster than the mobile HD 7970M. Thanks to Ivy Bridge, the CPU side of the equation is actually pretty close, so the overall scores don’t always reflect the difference but the graphics tests do. The physics tests even have a few instances of mobile CPUs besting Bloomfield, which is pretty accurate—with the latest process technology, Ivy Bridge can certainly keep up with my i7-965X.
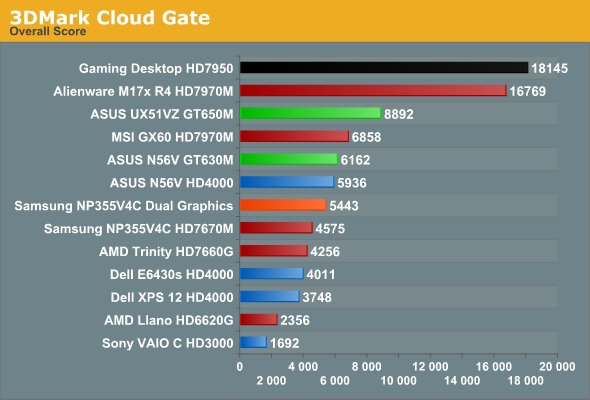
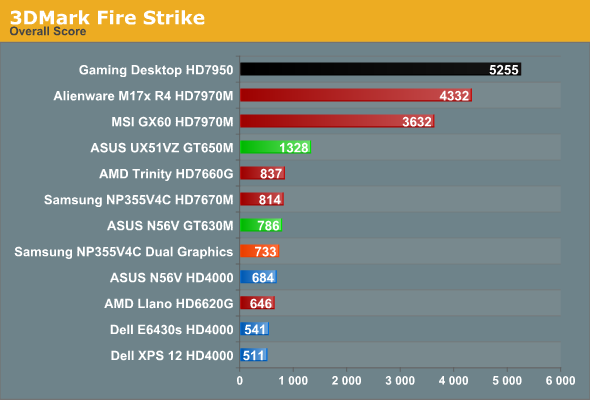
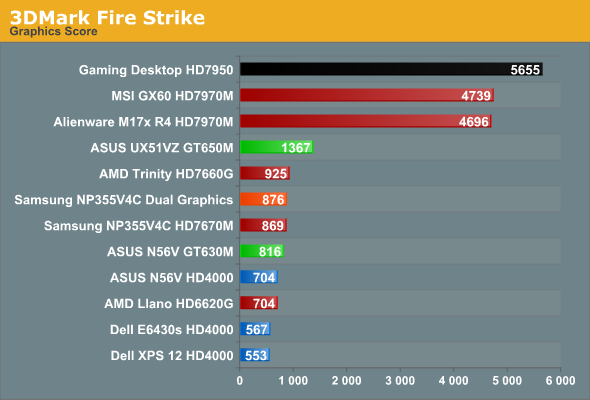
Moving to the mobile comparisons, at the high end we have two laptops with HD 7970M, one with Ivy Bridge and one with Trinity. I made a video a while back showing the difference between the two systems running just one game (Batman), and 3DMark again shows that with HD 7970M, Trinity APUs are a bottleneck in many instances. Cloud Gate has the Trinity setup get closer to the IVB system, and on the Graphics score the MSI GX60 actually came out just ahead in the Fire Strike test, but in the Physics and Overall scores it’s never all that close. Physics in particular shows very disappointing results for the AMD APUs, which is why even Sandy Bridge with HD 3000 is able to match Llano in the Ice Storm benchmark (though not in the Graphics result).
A look at the ASUS UX51VZ also provides some interesting food for thought: thanks to the much faster CPU, even a moderate GPU like the GT 650M can surpass the 3DMark results of the MSI GX60 in two of the overall scores. That’s probably a bit much, but there are titles (Skyrim for instance) where CPU performance is very important, and in those cases the 3DMark rankings of the UX51VZ and the GX60 are likely to match up; in most demanding games (or games at higher resolutions/settings), however, you can expect the GX60 to deliver a superior gaming experience that more closely resembles the Fire Strike results.
The Samsung Series 3 with Dual Graphics is another interesting story. In many of the individual tests, the second GPU goes almost wholly unused—note that I’d expect updated drivers to improve the situation, if/when they become available. The odd man out is the Cloud Gate Graphics test, which scales almost perfectly with Dual Graphics. Given how fraught CrossFire can be even on a desktop system, the fact that Dual Graphics works at all with asymmetrical hardware is almost surprising. Unfortunately, with Trinity generally being underpowered on the CPU side and with the added overhead of Dual Graphics (aka Asymmetrical CrossFire), there are many instances where you’re better off running with just the 7670M and leaving the 7660G idle. I’m still working on a full review of the Samsung, but while Dual Graphics is now at least better than what I experienced with the Llano prototype, it’s not perfect by any means.
Wrapping things up, we have the HD 4000 in three flavors: i7-3720QM, i5-3360M, and i7-3517U. While in theory they iGPU is clocked similarly, as I showed back in June, on a ULV platform the 17W TDP is often too little to allow the HD 4000 to reach its full potential. Under a full load, it looks like HD 4000 in a ULV processor can consume roughly 10-12W, but the CPU side can also use up to 15W. Run a taxing game where both the CPU and iGPU are needed and something has to give; that something is usually iGPU clocks, but the CPU tends to throttle as well. Interestingly, 3DMark only really seems to show this limitation with the Ice Storm tests; the other two benchmarks give the dual-core i5-3360M and i7-3517U very close results. In actual games, however, I don’t expect that to be the case very often (meaning, Ice Storm is likely the best representation of how HD 4000 scales across various CPU and TDP configurations).
HD 4000 also tends to place quite well with respect to Trinity and some of the discrete GPUs, but in practice that’s rarely the case. GT 630M for instance was typically 50% to 100% (or slightly more) faster than HD 4000 in the ASUS N56V Ivy Bridge prototype, but looking at the 3DMark results it almost looks like a tie. Don’t believe those relative scores for an instant; they’re simply not representative of real gaming experiences. And that is one of the reasons why we continue to look at 3DMark as merely a rough estimate of performance potential; it often gives reasonable rankings, but unfortunately there are times (optimizations by drivers perhaps) where it clearly doesn’t tell the whole story. I’m almost curious to see what sort of results HD 4000 gets with some older Intel drivers, as my gut is telling me there may be some serious tuning going on in the latest build.


69 Comments
View All Comments
Hrel - Tuesday, February 5, 2013 - link
Are you guys ever gonna review those ARM based NAS boxes or not?humbi83 - Tuesday, February 5, 2013 - link
single(gs, phs,cs) / sli af1 / sli af2ice storm 30402 (27721,45965, - ) / 125970 (247612,46323,-) / 125551 (246867, 46159, - )
cloud gate 14687 (26205, 5786 , - ) / 18518 (49233,5817, - ) / 18501 (49182, 5812, - )
fire strike 3106 (3585, 8296 , 1057) / 5667 (6926 , 8330, 2007) / 5795 (7011,8306,2104)
Landspeeder - Tuesday, February 5, 2013 - link
Just what I was looking for!Any chance to try an OC on the CPU/GPUs?
JarredWalton - Tuesday, February 5, 2013 - link
I tried overclocking the GPU on a P170EM and it totally wouldn't work -- all the utilities I tried basically hard locked the system the instant you applied new clocks. If anyone has a recommended utility for overclocking notebooks, I'd like to know what it is.humbi83 - Wednesday, February 6, 2013 - link
Hmm... 7970m seems much more powerfull. 3585 vs ~4700. Maybe I could improve the score using new drivers but I don't have time for it (or overclocking or anything else until they disable the demos). SLI works by the way :D.A couple of things (long rant):
Disable the frigging demos (I'm starting to repeat myself, not OK) !!!!! or set them looping on some other button from the launcher.
No easily discernible screen tearing at 1k FPS (are they actually showing 1K or just offscreen + 60 on screen).
They have troubles with identifying the SLI on/off , GPU vendor, GPU speed etc.
You can see that the first test is targeted towards mobile stuff. Very bald looking (did I mentioned 1K fps?). What would be nice is to also see attached to the tests the GPU utilization (if not already done).
Phy tests seem rushed. Even in the last combined test, the rocks in the background fall kinda funny. BTW, cloth simulation is way off. Also .. was I using the gpu for physics?? Don't know, don't think so.
Looking over their "invalid config guide" seems that if you have a dedicated PPU the test is invalid. So what if the frigging cellphone can't do complex stuff, use all available hw at your disposal and then worry about scoring???!!!! Do you get better fps, then that is a good thing. Score it accordingly. FPS was a common denominator. Use it! Fidelity(phy&gfx) + Keeping the Illusion of movement is what the end user is concerned not what hw you use to get there. If the phone in your pocket can't do that ... well it's a phone, in another 3-5 years it will.
Last test/demo(actually just the combined part of the test) is what I was expecting, just that we should have had 3 of those not just 1 + 2 with fps >200. I mean 5 tests where 3 are actually DX11 with all the bells and whatnot. I have 4GB of mem per card, are you using that, I want the pcie to fry from all the swapping.
Also, use the demos as a more lengthy benchmark !!!
Thees tests should represent the future of content fidelity, now they waste their time with 10(actually between 9&11) year old tech because this is where the money is right now.
First time I ran 3dMark (2006) my PC was almost leaning towards seconds per frame in some situations. Now I get with a frigging laptop almost 10fps in their most demanding test. NOT OK. I know you can do better FM!!
Cheers!
Landspeeder - Wednesday, February 6, 2013 - link
I know XOTIC PC offers it on both the CPU and GPU... perhaps they can shed some light?akhaddd - Tuesday, February 5, 2013 - link
so frickin awesome i love me some computer stuffGTRagnarok - Tuesday, February 5, 2013 - link
Why is my Ice Storm score so high with my M17x R4 with a 3720QM and 7970M?http://www.3dmark.com/3dm/18860
129064 overall
244590 graphics
48646 physics
JarredWalton - Tuesday, February 5, 2013 - link
Are you using Enduro or do you have it disabled? I had it enabled on the M17x, so that could be the reason. Also, you're using 12.10 drivers and I'm using 13.1, so maybe that makes a difference.Krysto - Tuesday, February 5, 2013 - link
Disappointing that it won't support OpenGL ES 3.0 right from the start. Also I wonder how "fair" the tests will be between DirectX and OpenGL devices. Will games that look and work identical on these 2 different API's, get the same score?If not then it will be a pretty useless "cross-platform" benchmark. But we'll see.