Gigabyte H77N-WiFi Review – First Look at Ivy Bridge with mITX
by Ian Cutress on November 6, 2012 12:00 PM EST- Posted in
- Motherboards
- Gigabyte
- H77
- mITX
Rightmark Audio Analyzer 6.2.5
In part due to reader requests, we are pleased to include Rightmark Audio Analyzer results in our benchmark suite. The premise behind Rightmark:AA is to test the input and output of the audio system to determine noise levels, range, harmonic distortion, stereo crosstalk and so forth. Rightmark:AA should indicate how well the sound system is built and isolated from electrical interference (either internally or externally). For this test we connect the Line Out to the Line In using a short six inch 3.5mm to 3.5mm high-quality jack, turn the OS volume to 100%, and run the Rightmark default test suite at 48 kHz, 96 kHz and 192 kHz. The results are given both numerical ratings and word ratings from ‘Very Poor’ to ‘Excellent’. We grade this test by assigning each of the word ratings a value from 1-6, and the final result is the sum of these ratings, and the score should end up between 8 and 48.
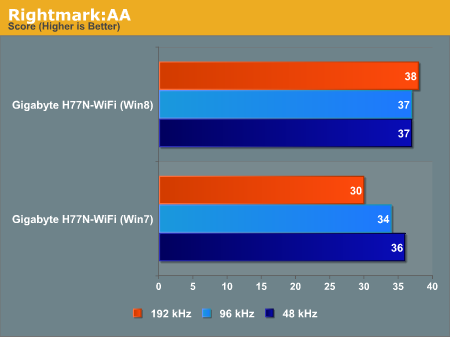
The Gigabyte board is our first motherboard on our test bed to go through Rightmark, so while we do not have any comparative numbers yet, but we can draw conclusions. In our testing, the Windows 7 performance rises with bit-rate, whereas the Windows 8 driver gives constant performance throughout. The dynamic range of the Realtek ALC892 is rated at 110 dBA ideal, but losses due to design come through – in this case the Gigabyte tops out at 86.2 dBA at 48 kHz.
USB Speed
For this benchmark, we run CrystalDiskMark to determine the ideal sequential read and write speeds for the USB port using our 240 GB OCZ Vertex3 SSD with a SATA 6 Gbps to USB 3.0 converter. Then we transfer a set size of files from the SSD to the USB drive using DiskBench, which monitors the time taken to transfer. The files transferred are a 1.52 GB set of 2867 files across 320 folders – 95% of these files are small typical website files, and the rest (90% of the size) are the videos used in the Sorenson Squeeze test.
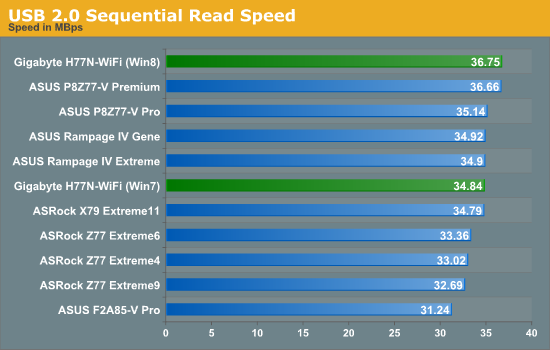
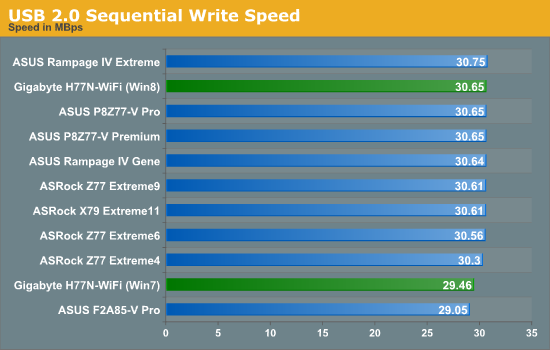
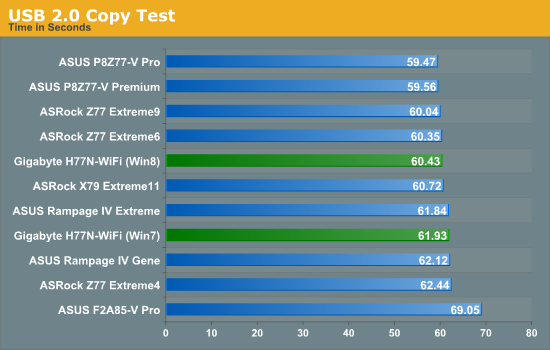
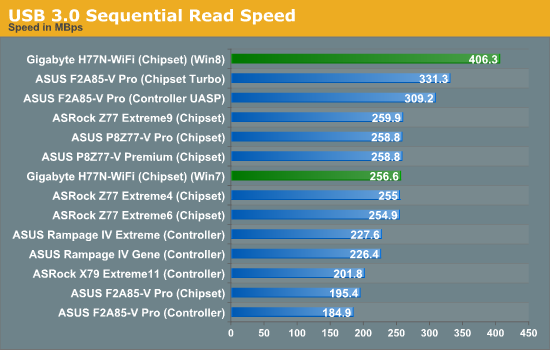
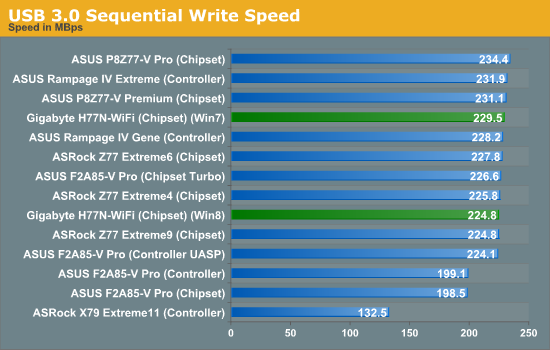
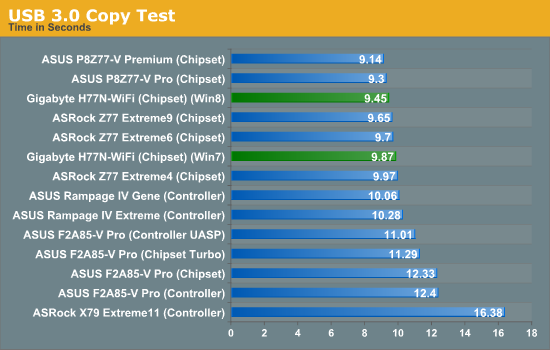
At some point in the future we will be adjusting our testing to Windows 8, which will be able to take advantage of the UASP protocol for USB 3.0 transfers. In our performance review of Windows 8 this manifested itself in an increase in sequential USB 3.0 read speed from 256.6 Mbps to 406.30 Mbps, which meant a 4% quicker USB copy test as writing was not similarly affected.
DPC Latency
Deferred Procedure Call latency is a way in which Windows handles interrupt servicing. In order to wait for a processor to acknowledge the request, the system will queue all interrupt requests by priority. Critical interrupts will be handled as soon as possible, whereas lesser priority requests, such as audio, will be further down the line. So if the audio device requires data, it will have to wait until the request is processed before the buffer is filled. If the device drivers of higher priority components in a system are poorly implemented, this can cause delays in request scheduling and process time, resulting in an empty audio buffer – this leads to characteristic audible pauses, pops and clicks. Having a bigger buffer and correctly implemented system drivers obviously helps in this regard. The DPC latency checker measures how much time is processing DPCs from driver invocation – the lower the value will result in better audio transfer at smaller buffer sizes. Results are measured in microseconds and taken as the peak latency while cycling through a series of short HD videos - under 500 microseconds usually gets the green light, but the lower the better.
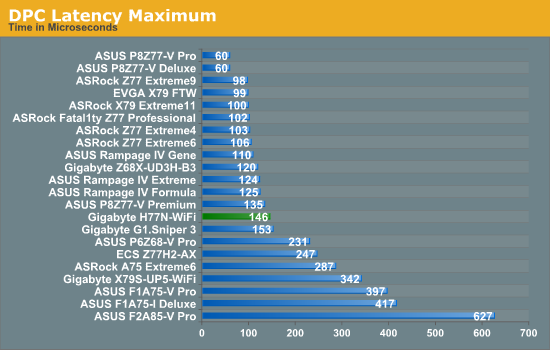
The DPC Latency test is starting to become one where we have two different types of motherboard manufacturer. The top tier manufacturers offer better software with their products, often with monitoring tools as part of the package in order to monitor overclocks or fan speeds. These monitoring tools inject high priority requests in the system on a regular basis (every 1-3 seconds), delaying other requests such as those for audio, causing spikes in DPC Latency which could lead to distortion or other audio anomalies. Surprisingly manufacturers without these tools do not have these issues. These issues are sometimes fixed via a BIOS update, but even if one board gets updated and fixed, it for some reason does not propagate to future products or the back catalogue. So here we are with the Gigabyte H77N-WiFi, which gives a good sub-200 microsecond result, but unfortunately while EasyTune6 is enabled, this can spike to 32000 microseconds. Ouch.


52 Comments
View All Comments
Geraldo8022 - Wednesday, November 7, 2012 - link
I like the placement of the 24 pin power header. My E350 case has the external power button right where it interferes with the power header toward inside of front panel. Also I like testing with i3. I go for lowest power consumption. I use a picoPSU and would like to see these tested with that psu. For me it is a USB world. all I care about is HDTV, low power and USB3. If you want to overclock perhaps you should go with a bigger board.Pcosx - Wednesday, November 7, 2012 - link
Why don't anybody makes a z77/h77 board with dual link dvi output? Is it so much more to make one?Dug - Friday, November 9, 2012 - link
Good question, and it would be nice to know the limitations of video output on these motherboards with different connections.Znarkus - Thursday, November 8, 2012 - link
Why present POST time with two decimal points, if there is a 1 second error margin?IanCutress - Friday, December 7, 2012 - link
Results from my stop watch. Error margin is a large overestimate of what it might be from human error, not hardware error. For each reading I take 3 measurements, and more often than not I get all three in the same 0.10 seconds.Ian
lwatcdr - Thursday, November 8, 2012 - link
I would love to know how well this is supported under Linux? No real need for Benchmarks just put Ubuntu, Mint, or Fedora on it and see if the Network, WiFi, Video, Sata, and USB all work.Also Hackintosh compatibility would be nice but maybe too out their to be worth your time but would be very cool.
mrgreenfur - Friday, November 9, 2012 - link
The spec table shows z77 chipset, should be h77?dingetje - Wednesday, November 21, 2012 - link
please include the EVGA Z77 Stinger Mini-ITX Motherboard in the upcoming article.thanks
lemmo - Tuesday, February 26, 2013 - link
Thanks for the detailed review. Could you give an idea of what the audio benchmark actually means? Do those results indicate that the audio quality is good or bad?A review of the Gigabyte B75 ITX board shows that the audio quality is poor, and the Gigabyte Z77 board not much better. They also use Rightmark Audio Analyser, but represent the results differently so there is no way to compare. Please can you give your audio test results in dB(A) so we can compare?
http://uk.hardware.info/reviews/3645/6/gigabyte-ga...
It would also be good to have a wider comparison of the power draw, say with the Z77 ITX boards you reviewed.
raavan19raavan - Monday, April 15, 2013 - link
have problems with the graphics card!! Works fine with the graphics BIOS settings at auto but does not work with BIOS settings with graphics set to PEG and changed the miscellaneous settings from Auto to Gen1,Gen3 but still didnt work. Tested it on different systems and it seems to work fine but does not work only on this mobo, the mobo itself is fine again. The graphics card is a HD6670 1GB DDR5.