OCZ Vector (256GB) Review
by Anand Lal Shimpi on November 27, 2012 9:10 PM ESTAnandTech Storage Bench 2011
Two years ago we introduced our AnandTech Storage Bench, a suite of benchmarks that took traces of real OS/application usage and played them back in a repeatable manner. I assembled the traces myself out of frustration with the majority of what we have today in terms of SSD benchmarks.
Although the AnandTech Storage Bench tests did a good job of characterizing SSD performance, they weren't stressful enough. All of the tests performed less than 10GB of reads/writes and typically involved only 4GB of writes specifically. That's not even enough exceed the spare area on most SSDs. Most canned SSD benchmarks don't even come close to writing a single gigabyte of data, but that doesn't mean that simply writing 4GB is acceptable.
Originally I kept the benchmarks short enough that they wouldn't be a burden to run (~30 minutes) but long enough that they were representative of what a power user might do with their system.
Not too long ago I tweeted that I had created what I referred to as the Mother of All SSD Benchmarks (MOASB). Rather than only writing 4GB of data to the drive, this benchmark writes 106.32GB. It's the load you'd put on a drive after nearly two weeks of constant usage. And it takes a *long* time to run.
1) The MOASB, officially called AnandTech Storage Bench 2011 - Heavy Workload, mainly focuses on the times when your I/O activity is the highest. There is a lot of downloading and application installing that happens during the course of this test. My thinking was that it's during application installs, file copies, downloading and multitasking with all of this that you can really notice performance differences between drives.
2) I tried to cover as many bases as possible with the software I incorporated into this test. There's a lot of photo editing in Photoshop, HTML editing in Dreamweaver, web browsing, game playing/level loading (Starcraft II & WoW are both a part of the test) as well as general use stuff (application installing, virus scanning). I included a large amount of email downloading, document creation and editing as well. To top it all off I even use Visual Studio 2008 to build Chromium during the test.
The test has 2,168,893 read operations and 1,783,447 write operations. The IO breakdown is as follows:
| AnandTech Storage Bench 2011 - Heavy Workload IO Breakdown | ||||
| IO Size | % of Total | |||
| 4KB | 28% | |||
| 16KB | 10% | |||
| 32KB | 10% | |||
| 64KB | 4% | |||
Only 42% of all operations are sequential, the rest range from pseudo to fully random (with most falling in the pseudo-random category). Average queue depth is 4.625 IOs, with 59% of operations taking place in an IO queue of 1.
Many of you have asked for a better way to really characterize performance. Simply looking at IOPS doesn't really say much. As a result I'm going to be presenting Storage Bench 2011 data in a slightly different way. We'll have performance represented as Average MB/s, with higher numbers being better. At the same time I'll be reporting how long the SSD was busy while running this test. These disk busy graphs will show you exactly how much time was shaved off by using a faster drive vs. a slower one during the course of this test. Finally, I will also break out performance into reads, writes and combined. The reason I do this is to help balance out the fact that this test is unusually write intensive, which can often hide the benefits of a drive with good read performance.
There's also a new light workload for 2011. This is a far more reasonable, typical every day use case benchmark. Lots of web browsing, photo editing (but with a greater focus on photo consumption), video playback as well as some application installs and gaming. This test isn't nearly as write intensive as the MOASB but it's still multiple times more write intensive than what we were running in 2010.
As always I don't believe that these two benchmarks alone are enough to characterize the performance of a drive, but hopefully along with the rest of our tests they will help provide a better idea.
The testbed for Storage Bench 2011 has changed as well. We're now using a Sandy Bridge platform with full 6Gbps support for these tests.
AnandTech Storage Bench 2011 - Heavy Workload
We'll start out by looking at average data rate throughout our new heavy workload test:
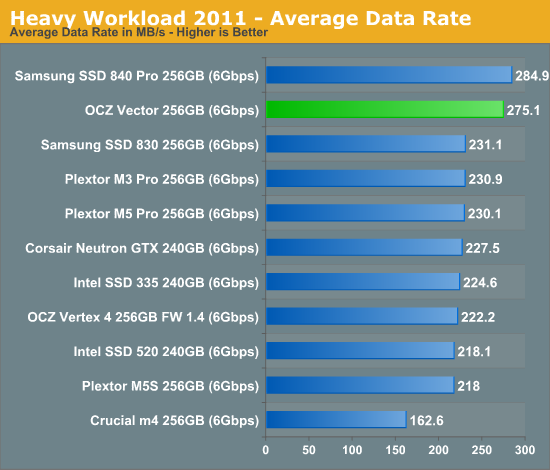
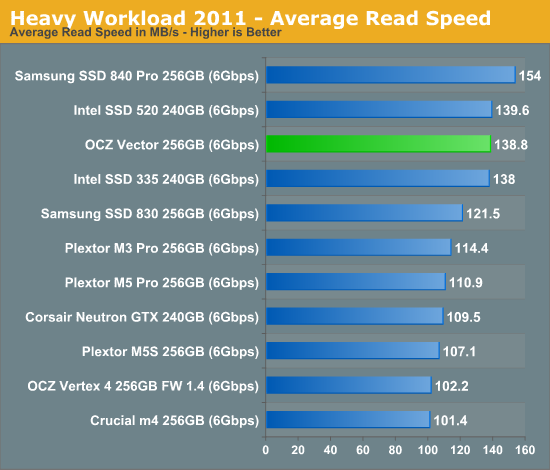
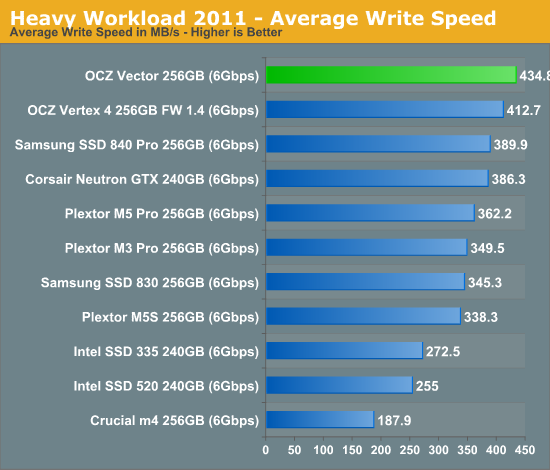
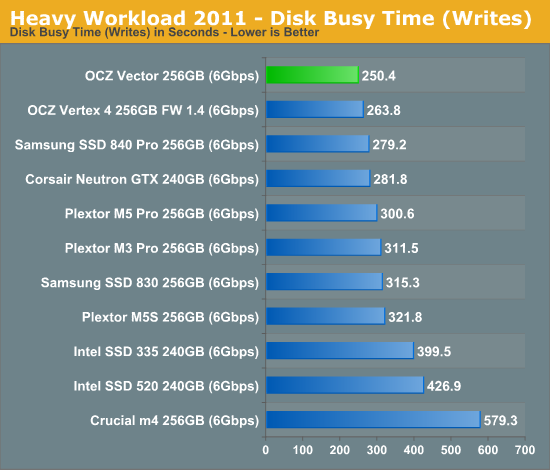
Here it is. OCZ's Vector comes within 4% of Samsung's SSD 840 Pro and manages a 22% increase in performance compared to the Vertex 4. The breakdown shows Vector's strong write performance are really what push it over the edge. At the same time, OCZ has finally addressed whatever poor read performance issues plagued the Vertex 4 in our test - the Vector is a different beast here.
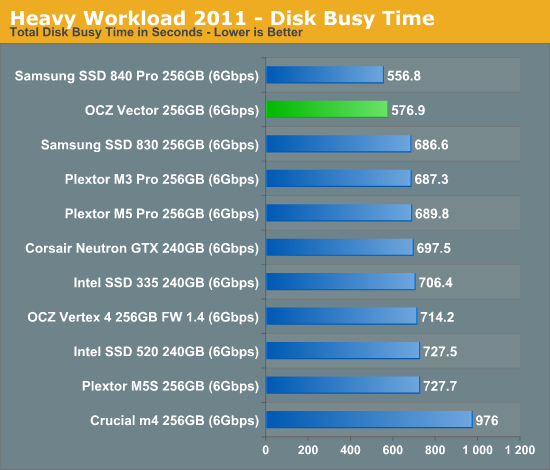
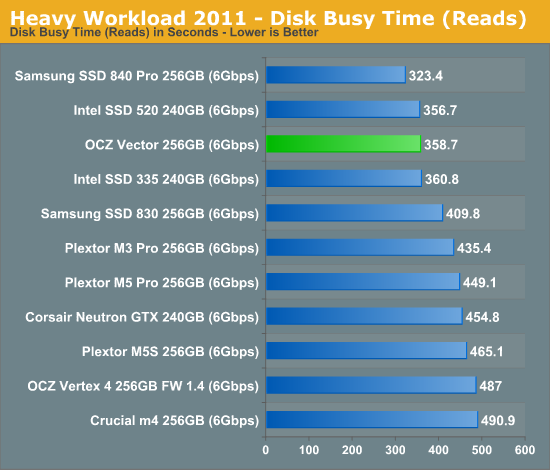
The next three charts just represent the same data, but in a different manner. Instead of looking at average data rate, we're looking at how long the disk was busy for during this entire test. Note that disk busy time excludes any and all idles, this is just how long the SSD was busy doing something:


151 Comments
View All Comments
dj christian - Thursday, November 29, 2012 - link
What is SZ80/100 in the graphs, what do they stand for?Anand Lal Shimpi - Wednesday, November 28, 2012 - link
You are correct, I ran a 100% span of the 4KB/QD32 random write test. The right way to do this test is actually to gather all IO latency data until you hit steady state, which you can usually do on most consumer drives after just a couple of hours of testing. The problem is the resulting dataset ends up being a pain to process and present.There is definitely a correlation between spare area and IO consistency, particularly on drives that delay their defragmentation routines quite a bit. If you look at the Intel SSD 710 results you'll notice that despite having much more spare area than the S3700, consistency is clearly worse.
As your results show though, for an emptier drive IO consistency isn't as big of a problem (although if you continued to write to it you'd eventually see the same issues as all of that spare area would get used up). I think there's definitely value in looking at exactly what you're presenting here. The interesting aspect to me is this tells us quite a bit about how well drives make use of empty LBA ranges.
I tend to focus on the worst case here simply because that ends up being what people notice the most. Given that consumers are often forced into a smaller capacity drive than they'd like, I'd love to encourage manufacturers to pursue architectures that can deliver consistent IO even with limited spare area available.
Take care,
Anand
jwilliams4200 - Wednesday, November 28, 2012 - link
Anand wrote:"As your results show though, for an emptier drive IO consistency isn't as big of a problem (although if you continued to write to it you'd eventually see the same issues as all of that spare area would get used up)."
Actually, all of my tests did use up all the spare area, and had reached steady state during the graph shown. Perhaps you have misunderstood how I did my tests. I just overprovisioned it so that it had almost as much spare area as the Intel S3700. Otherwise, I was doing the same thing as you did in your tests.
The conclusion to be drawn is that the Intel S3700 is not all that special. You can approach the same performance as the S3700 with a consumer SSD, at least with a Samsung 840 Pro, just by overprovisioning enough.
Look at this one again:
http://i.imgur.com/Vvo1H.png
It reaches steady state somewhere between 80 and 120GB. The spare area is used up at about 62GB and the speed drops precipitously, but then there is a span where the speed actually increases slightly, and then levels out somewhere around 80-120GB.
Note that steady state is about 110MB/sec. That is about 28K IOPS. Not as good as the Intel S3700, but certainly approaching it.
Ictus - Wednesday, November 28, 2012 - link
Hey J, thanks for taking the time to reply to me in the other comment.I think my question is even more noobish than you have assumed.
"I just overprovisioned it so that it had almost as much spare area as the Intel S3700. Otherwise, I was doing the same thing as you did in your tests."
I am confused because I thought the only way to "over-provision" was to create a partition that didn't use all the available space??? If you are merely writing raw data up to the 80% full level, what exactly does over provisioning mean? Does the term "over provisioning" just mean you didn't fill the entire drive, or you did something to the drive?
jwilliams4200 - Wednesday, November 28, 2012 - link
No, overprovisioning generally just means that you avoid writing to a certain range of LBAs (aka sectors) on the SSD. Certainly one way to do that is to create a partition smaller than the capacity of the SSD. But that is completely equivalent to writing to the raw device but NOT writing to a certain range of LBAs. The key is that if you don't write to certain LBAs, however that is accomplished, then the SSD's flash translation table (FTL) will not have any mapping for those LBAs, and some or all SSDs will be smart enough to use those unmapped-LBAs as spare area to improve performance and wear-leveling.So no, I did not "do something to the drive". All I did was make sure that fio did not write to any LBAs past the 80% mark.
gattacaDNA - Sunday, December 2, 2012 - link
"The conclusion to be drawn is that the Intel S3700 is not all that special. You can approach the same performance as the S3700 with a consumer SSD, at least with a Samsung 840 Pro, just by overprovisioning enough."WOW - this is an interesting discussion which concludes that by simply over-provisioning a consumer SSD by 20-30% those units can approach the vetted S3700! I had to re-read those posts 2x to be sure I read that correctly.
It seems some later posts state that if the workload is not sustained (drive can recover) and the drive is not full, that the OP has little to no benefit.
So is an best bang really just not fill the drives past 75% of the available area and call it a day?
jwilliams4200 - Sunday, December 2, 2012 - link
The conclusion I draw from the data is that if you have a Samsung 840 Pro (or similar SSD, I believe several consumer SSDs behave similarly with respect to OP), and the big one -- IF you have a very heavy, continuous write workload, then you can achieve large improvements in throughput and huge improvements in maximum latency if you overprovision at 80% (i.e., leave 20% unwritten or unpartitioned)Note that such OP is not needed for most desktop users, for two reasons. First, most desktop users will not fill the drive 100% and as long as they have TRIM working, and if the drive is only filled to 80% (even if the filesystem covers all 100%), then it should behave as if it were actually overprovisioned at 80%. Second, most desktop users do not continuously write tens of Gigabytes of data without pause.
gattacaDNA - Sunday, December 2, 2012 - link
Thank You. That's what my take-away is as well.jwilliams4200 - Wednesday, November 28, 2012 - link
By the way, I am not sure why you say the data sets are "a pain to process and present". I have written some test scripts to take the data automatically and to produce the graphs automatically. I just hot-swap the SSD in, run the script, and then come back when it is done to look at the graphs.Also, the best way to present latency data is in a cumulative distribution function (CDF) plot with a normal probability scale on the y-axis, like this:
http://i.imgur.com/RcWmn.png
http://i.imgur.com/arAwR.png
One other tip is that it does not take hours to reach steady state if you use a random map. This means that you do a random write to all the LBAs, but instead of sampling with replacement, you keep a map of the LBAs you have already written to and don't randomly select the same ones again. In other words, write each 4K-aligned LBA on a tile, put all the tiles in a bag, and randomly draw the tiles out but do not put the drawn tile back in before you select the next tile. I use the 'fio' program to do this. With an SSD like the Samsung 840 Pro (or any SSD than can do 300+ MB/s 4KQD32 random writes), you only have to write a little more than the capacity of the SSD (eg., 256GB + 7% of 256GB) to reach steady state. This can be done in 10 or 20 minutes on fast SSDs.
Brahmzy - Wednesday, November 28, 2012 - link
I consistently over-provision every single SSD I use by at least 20%. I have had stellar performance doing this with 50-60+ SSDs over the years.I do this on friend's/family's builds and tell anybody I know to do this with theirs. So, with my tiny sample here, OP'ing SSDs is a big deal, and it works. I know many others do this as well. I base my purchase decisions with OP in mind. If I need 60GB of space, I'll buy a 120GB. If I need 120GB of usable space, I'll buy a 250GB drive, etc.
I think it would be valuable addition to the Anand suite of tests to account for this option that many of us use. Maybe a 90% OP write test and maybe an 80% OP write test. Assuming there's a constitent difference between the two.