OCZ Vector (256GB) Review
by Anand Lal Shimpi on November 27, 2012 9:10 PM ESTAnandTech Storage Bench 2011
Two years ago we introduced our AnandTech Storage Bench, a suite of benchmarks that took traces of real OS/application usage and played them back in a repeatable manner. I assembled the traces myself out of frustration with the majority of what we have today in terms of SSD benchmarks.
Although the AnandTech Storage Bench tests did a good job of characterizing SSD performance, they weren't stressful enough. All of the tests performed less than 10GB of reads/writes and typically involved only 4GB of writes specifically. That's not even enough exceed the spare area on most SSDs. Most canned SSD benchmarks don't even come close to writing a single gigabyte of data, but that doesn't mean that simply writing 4GB is acceptable.
Originally I kept the benchmarks short enough that they wouldn't be a burden to run (~30 minutes) but long enough that they were representative of what a power user might do with their system.
Not too long ago I tweeted that I had created what I referred to as the Mother of All SSD Benchmarks (MOASB). Rather than only writing 4GB of data to the drive, this benchmark writes 106.32GB. It's the load you'd put on a drive after nearly two weeks of constant usage. And it takes a *long* time to run.
1) The MOASB, officially called AnandTech Storage Bench 2011 - Heavy Workload, mainly focuses on the times when your I/O activity is the highest. There is a lot of downloading and application installing that happens during the course of this test. My thinking was that it's during application installs, file copies, downloading and multitasking with all of this that you can really notice performance differences between drives.
2) I tried to cover as many bases as possible with the software I incorporated into this test. There's a lot of photo editing in Photoshop, HTML editing in Dreamweaver, web browsing, game playing/level loading (Starcraft II & WoW are both a part of the test) as well as general use stuff (application installing, virus scanning). I included a large amount of email downloading, document creation and editing as well. To top it all off I even use Visual Studio 2008 to build Chromium during the test.
The test has 2,168,893 read operations and 1,783,447 write operations. The IO breakdown is as follows:
| AnandTech Storage Bench 2011 - Heavy Workload IO Breakdown | ||||
| IO Size | % of Total | |||
| 4KB | 28% | |||
| 16KB | 10% | |||
| 32KB | 10% | |||
| 64KB | 4% | |||
Only 42% of all operations are sequential, the rest range from pseudo to fully random (with most falling in the pseudo-random category). Average queue depth is 4.625 IOs, with 59% of operations taking place in an IO queue of 1.
Many of you have asked for a better way to really characterize performance. Simply looking at IOPS doesn't really say much. As a result I'm going to be presenting Storage Bench 2011 data in a slightly different way. We'll have performance represented as Average MB/s, with higher numbers being better. At the same time I'll be reporting how long the SSD was busy while running this test. These disk busy graphs will show you exactly how much time was shaved off by using a faster drive vs. a slower one during the course of this test. Finally, I will also break out performance into reads, writes and combined. The reason I do this is to help balance out the fact that this test is unusually write intensive, which can often hide the benefits of a drive with good read performance.
There's also a new light workload for 2011. This is a far more reasonable, typical every day use case benchmark. Lots of web browsing, photo editing (but with a greater focus on photo consumption), video playback as well as some application installs and gaming. This test isn't nearly as write intensive as the MOASB but it's still multiple times more write intensive than what we were running in 2010.
As always I don't believe that these two benchmarks alone are enough to characterize the performance of a drive, but hopefully along with the rest of our tests they will help provide a better idea.
The testbed for Storage Bench 2011 has changed as well. We're now using a Sandy Bridge platform with full 6Gbps support for these tests.
AnandTech Storage Bench 2011 - Heavy Workload
We'll start out by looking at average data rate throughout our new heavy workload test:
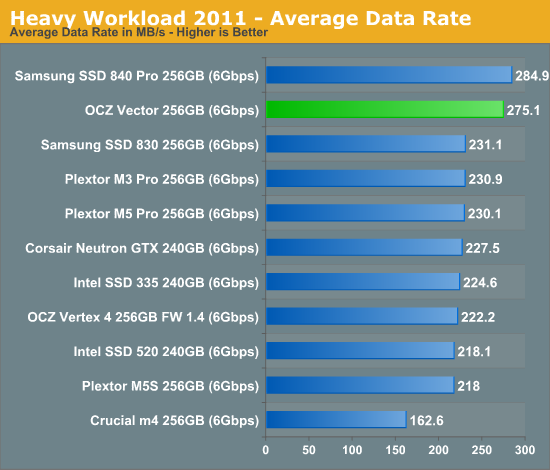
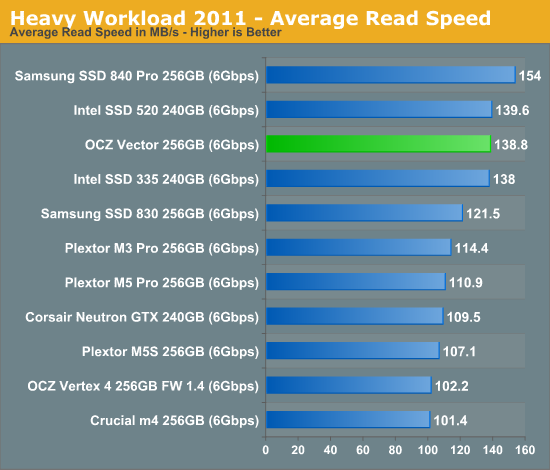
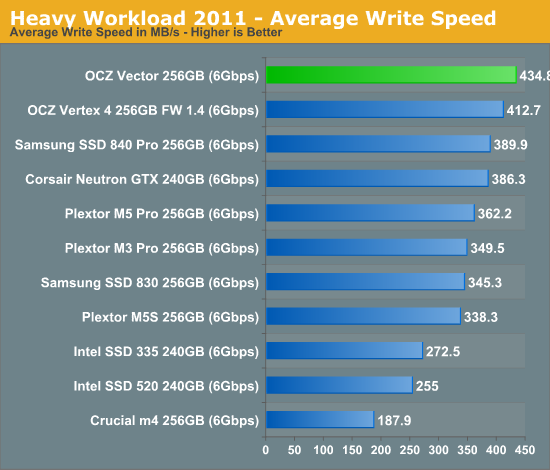
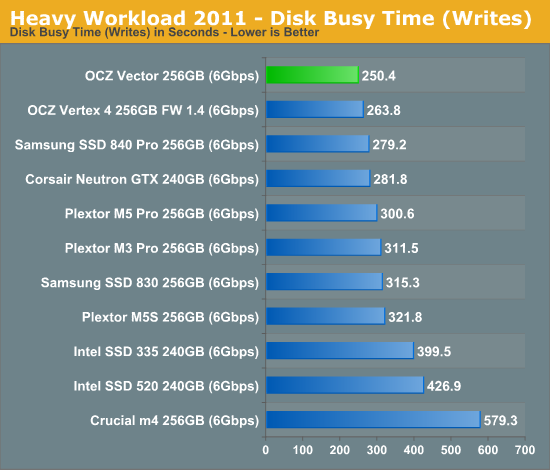
Here it is. OCZ's Vector comes within 4% of Samsung's SSD 840 Pro and manages a 22% increase in performance compared to the Vertex 4. The breakdown shows Vector's strong write performance are really what push it over the edge. At the same time, OCZ has finally addressed whatever poor read performance issues plagued the Vertex 4 in our test - the Vector is a different beast here.
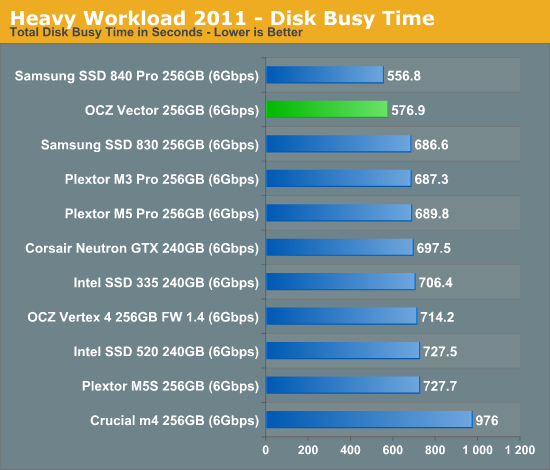
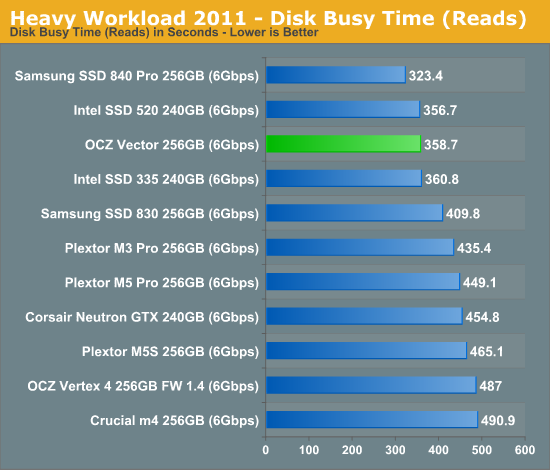
The next three charts just represent the same data, but in a different manner. Instead of looking at average data rate, we're looking at how long the disk was busy for during this entire test. Note that disk busy time excludes any and all idles, this is just how long the SSD was busy doing something:


151 Comments
View All Comments
jeffrey - Tuesday, November 27, 2012 - link
Anand,I would love to have seen results using the 1.5 firmware for the 256GB Vertex 4. Going from 1.4 to 1.5 is non destructive. The inconsistency of graphs in other SSD reviews that included the 512GB Vertex 4 drive with 1.5 firmware and the 256GB Vertex 4 drive with 1.4 firmware drove me nuts.
When I saw the Barefoot 3 press release on Yahoo Finance, I immediately went to your site hoping to see the review. I was happy to see the article up, but when I saw your review sample was 256GB I feared you would not have updated the firmware on the Vertex 4 yet. Unfortunately, my fears were confirmed. I love your site, that's why I'm sharing my $.02 as a loyal reader.
Take care,
Jeffrey
Anand Lal Shimpi - Wednesday, November 28, 2012 - link
Some of the results are actually using the 1.5 firmware (IO consistency, steady state 4KB random write performance). We didn't notice a big performance difference between 1.4 and 1.5 which is why I didn't rerun on 1.5 for everything.Take care,
Anand
iwod - Tuesday, November 27, 2012 - link
Isn't this similar? Sandforce comes in, reached top speed in SATA 6Gbps, then other controller, Marvell, Barefoot managed to catch up. That is exactly what happen before with SATA 3Gbps Port. So in 2013 we would have controller and SSD all offering similar performance bottlenecked by its Port Speed.When are we going to see SATA Express that give us 20Gbps? We need those ASAP.
A5 - Wednesday, November 28, 2012 - link
SATA Express (on PCIe 3.0) will top out at 16 Gbps until PCIe 4.0 is out. This is the same bandwidth as single-channel DDR3-2133, by the way, so 16 Gbps should be plenty of performance for the next several years.extide - Wednesday, November 28, 2012 - link
Actually I believe Single Channel DDR-2133 is 16GiB a sec, not Gb a sec, so Sata Express is only ~1/8th the speed of single channel DDR3-2133jwilliams4200 - Wednesday, November 28, 2012 - link
It is good to see anandtech including results of performance consistency tests under a heavy write workload. However, there is a small or addition you should make for these results to be much more useful.You fill the SSDs up to 100% with sequential writes and I assume (I did not see a specification in your article) do 100% full-span 4KQD32 random writes. I agree that will give a good idea of worst-case performance, but unfortunately it does not give a good idea of how someone with that heavy a writeload would use these consumer SSDs.
Note that the consumer SSDs only have about 7% spare area reserved. However, if you overprovision them, some (all?) of them may make good use of the extra reserved space. The Intel S3700 only makes available 200GB / 264GiB of flash, which comes to 70.6% available, or 29.4% of the on-board flash is reserved as spare area.
What happens if you overprovision the Vector a similar amount? Or to take a round number, only use 80% of the available capacity of 256GB, which comes to just under 205GB.
I don't know how well the Vector uses the extra reserved space, but I do know that it makes a HUGE improvement on the 256GB Samsung 840 Pro. Below are some graphs of my own tests on the 840 Pro. I included graphs of Throughput vs. GB written, as well as latency vs. time. One the 80% graphs, I first wrote to all the sectors up to the 80% mark, then I did a 80% span 4KQD32 random write. On the 100% graphs, I did basically the same as anandtech did, filling up 100% of the LBAs then doing a 100% full-span 4KQD32 random write. Note that when the 840 Pro is only used up to 80%, it improves by a factor of about 4 in throughput, and about 15 in average latency (more than a 100 times improvement in max latency). It is approaching the performance of the Intel S3700. If I used 70% instead of 80% (to match the S3700), perhaps it would be even better.
Here are some links to my test data graphs:
http://i.imgur.com/MRZAM.png
http://i.imgur.com/Vvo1H.png
http://i.imgur.com/eYj7w.png
http://i.imgur.com/AMYoe.png
Ictus - Wednesday, November 28, 2012 - link
Just so I am clear, did you actually re create the partition utilitizing 80% of the space, or just keep the used space at 80% ?jwilliams4200 - Wednesday, November 28, 2012 - link
No partitions, no filesystems. I'm just writing to the raw device. In the 80% case, I just avoided writing to any LBAs higher than 80%.JellyRoll - Wednesday, November 28, 2012 - link
Excellent testing, very relevant, and thanks for sharing. How do you feel that the lack of TRIM in this type of testing affects the results? Do you feel that testing without a partition and TRIM would not provide an accurate depiction of real world performance?jwilliams4200 - Wednesday, November 28, 2012 - link
I just re-read your comment, and I thought perhaps you were asking about sequence of events instead of what I just answered you. The sequence is pretty much irrelevant since I did a secure erase before starting to write to the SSD.1) Secure erase SSD
2) Write to all LBAs up to 80%
3) 80% span 4KQD32 random write