OCZ Vector (256GB) Review
by Anand Lal Shimpi on November 27, 2012 9:10 PM ESTPerformance Consistency
In our Intel SSD DC S3700 review I introduced a new method of characterizing performance: looking at the latency of individual operations over time. The S3700 promised a level of performance consistency that was unmatched in the industry, and as a result needed some additional testing to show that. The reason we don't have consistent IO latency with SSDs is because inevitably all controllers have to do some amount of defragmentation or garbage collection in order to continue operating at high speeds. When and how an SSD decides to run its defrag and cleanup routines directly impacts the user experience. Frequent (borderline aggressive) cleanup generally results in more stable performance, while delaying that can result in higher peak performance at the expense of much lower worst case performance. The graphs below tell us a lot about the architecture of these SSDs and how they handle internal defragmentation.
To generate the data below I took a freshly secure erased SSD and filled it with sequential data. This ensures that all user accessible LBAs have data associated with them. Next I kicked off a 4KB random write workload at a queue depth of 32 using incompressible data. I ran the test for just over half an hour, no where near what we run our steady state tests for but enough to give me a good look at drive behavior once all spare area filled up.
I recorded instantaneous IOPS every second for the duration of the test. I then plotted IOPS vs. time and generated the scatter plots below. Each set of graphs features the same scale. The first two sets use a log scale for easy comparison, while the last set of graphs uses a linear scale that tops out at 40K IOPS for better visualization of differences between drives.
The first set of graphs shows the performance data over the entire 2000 second test period. In these charts you'll notice an early period of very high performance followed by a sharp dropoff. What you're seeing in that case is the drive alllocating new blocks from its spare area, then eventually using up all free blocks and having to perform a read-modify-write for all subsequent writes (write amplification goes up, performance goes down).
The second set of graphs zooms in to the beginning of steady state operation for the drive (t=1400s). The third set also looks at the beginning of steady state operation but on a linear performance scale. Click the buttons below each graph to switch source data.
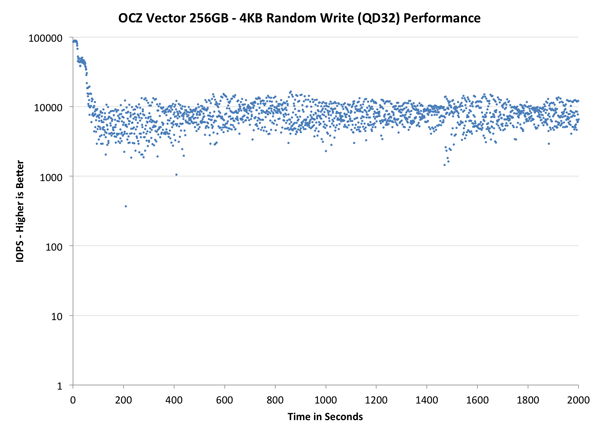
Here we see a lot of the code re-use between the Vector and Vertex 4 firmware. Vector performs like a faster Vertex 4, with all of its datapoints shifted up in the graph. The distribution of performance is a bit tighter than on the Vertex 4 and performance is definitely more consistent than the 840 Pro. The S3700 is obviously in a league of its own here, but I do hope that over time we'll see similarly consistent drives from other vendors.
The next set of charts look at the steady state (for most drives) portion of the curve. Here we'll get some better visibility into how everyone will perform over the long run.
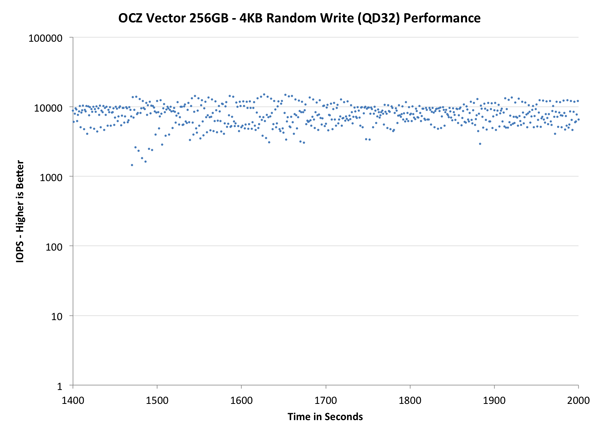
The source data is the same, we're just focusing on a different part of the graph. Here the Vector actually looks pretty good compared to all non-S3700 drives. In this case the Vector's performance distribution looks a lot like SandForce. There's a clear advantage again over the 840 Pro and Vertex 4.
The final set of graphs abandons the log scale entirely and just looks at a linear scale that tops out at 40K IOPS. We're also only looking at steady state (or close to it) performance here:
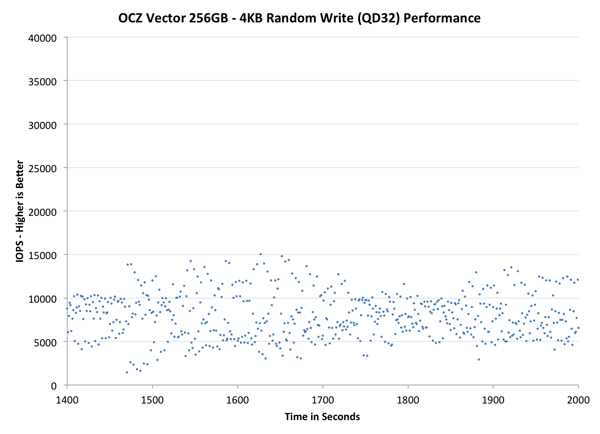
If we look at the tail end of the graph with a linear scale, we get a taste of the of just how varied IO latency can be with most of these drives. Vector looks much more spread out than the Vertex 4, but that's largely a function of the fact that its performance is just so much higher without an equivalent increase in aggressive defrag/GC routines. The 840 Pro generally manages lower performance in this worst case scenario. The SandForce based Intel SSD 330 shows a wide range of IO latencies but overall performance is much better. Had SandForce not been plagued by so many poorly handled reliability issues it might have been a better received option today.
From an IO consistency perspective, the Vector looks a lot like a better Vertex 4 or 840 Pro. Architecturally I wouldn't be too surprised if OCZ's method of NAND mapping and flash management wasn't very similar to Samsung's, which isn't a bad thing at all. I would like to see more emphasis placed on S3700-style IO consistency though. I do firmly believe that the first company to deliver IO consistency for the client space will reap serious rewards.


151 Comments
View All Comments
jeffrey - Tuesday, November 27, 2012 - link
Anand,I would love to have seen results using the 1.5 firmware for the 256GB Vertex 4. Going from 1.4 to 1.5 is non destructive. The inconsistency of graphs in other SSD reviews that included the 512GB Vertex 4 drive with 1.5 firmware and the 256GB Vertex 4 drive with 1.4 firmware drove me nuts.
When I saw the Barefoot 3 press release on Yahoo Finance, I immediately went to your site hoping to see the review. I was happy to see the article up, but when I saw your review sample was 256GB I feared you would not have updated the firmware on the Vertex 4 yet. Unfortunately, my fears were confirmed. I love your site, that's why I'm sharing my $.02 as a loyal reader.
Take care,
Jeffrey
Anand Lal Shimpi - Wednesday, November 28, 2012 - link
Some of the results are actually using the 1.5 firmware (IO consistency, steady state 4KB random write performance). We didn't notice a big performance difference between 1.4 and 1.5 which is why I didn't rerun on 1.5 for everything.Take care,
Anand
iwod - Tuesday, November 27, 2012 - link
Isn't this similar? Sandforce comes in, reached top speed in SATA 6Gbps, then other controller, Marvell, Barefoot managed to catch up. That is exactly what happen before with SATA 3Gbps Port. So in 2013 we would have controller and SSD all offering similar performance bottlenecked by its Port Speed.When are we going to see SATA Express that give us 20Gbps? We need those ASAP.
A5 - Wednesday, November 28, 2012 - link
SATA Express (on PCIe 3.0) will top out at 16 Gbps until PCIe 4.0 is out. This is the same bandwidth as single-channel DDR3-2133, by the way, so 16 Gbps should be plenty of performance for the next several years.extide - Wednesday, November 28, 2012 - link
Actually I believe Single Channel DDR-2133 is 16GiB a sec, not Gb a sec, so Sata Express is only ~1/8th the speed of single channel DDR3-2133jwilliams4200 - Wednesday, November 28, 2012 - link
It is good to see anandtech including results of performance consistency tests under a heavy write workload. However, there is a small or addition you should make for these results to be much more useful.You fill the SSDs up to 100% with sequential writes and I assume (I did not see a specification in your article) do 100% full-span 4KQD32 random writes. I agree that will give a good idea of worst-case performance, but unfortunately it does not give a good idea of how someone with that heavy a writeload would use these consumer SSDs.
Note that the consumer SSDs only have about 7% spare area reserved. However, if you overprovision them, some (all?) of them may make good use of the extra reserved space. The Intel S3700 only makes available 200GB / 264GiB of flash, which comes to 70.6% available, or 29.4% of the on-board flash is reserved as spare area.
What happens if you overprovision the Vector a similar amount? Or to take a round number, only use 80% of the available capacity of 256GB, which comes to just under 205GB.
I don't know how well the Vector uses the extra reserved space, but I do know that it makes a HUGE improvement on the 256GB Samsung 840 Pro. Below are some graphs of my own tests on the 840 Pro. I included graphs of Throughput vs. GB written, as well as latency vs. time. One the 80% graphs, I first wrote to all the sectors up to the 80% mark, then I did a 80% span 4KQD32 random write. On the 100% graphs, I did basically the same as anandtech did, filling up 100% of the LBAs then doing a 100% full-span 4KQD32 random write. Note that when the 840 Pro is only used up to 80%, it improves by a factor of about 4 in throughput, and about 15 in average latency (more than a 100 times improvement in max latency). It is approaching the performance of the Intel S3700. If I used 70% instead of 80% (to match the S3700), perhaps it would be even better.
Here are some links to my test data graphs:
http://i.imgur.com/MRZAM.png
http://i.imgur.com/Vvo1H.png
http://i.imgur.com/eYj7w.png
http://i.imgur.com/AMYoe.png
Ictus - Wednesday, November 28, 2012 - link
Just so I am clear, did you actually re create the partition utilitizing 80% of the space, or just keep the used space at 80% ?jwilliams4200 - Wednesday, November 28, 2012 - link
No partitions, no filesystems. I'm just writing to the raw device. In the 80% case, I just avoided writing to any LBAs higher than 80%.JellyRoll - Wednesday, November 28, 2012 - link
Excellent testing, very relevant, and thanks for sharing. How do you feel that the lack of TRIM in this type of testing affects the results? Do you feel that testing without a partition and TRIM would not provide an accurate depiction of real world performance?jwilliams4200 - Wednesday, November 28, 2012 - link
I just re-read your comment, and I thought perhaps you were asking about sequence of events instead of what I just answered you. The sequence is pretty much irrelevant since I did a secure erase before starting to write to the SSD.1) Secure erase SSD
2) Write to all LBAs up to 80%
3) 80% span 4KQD32 random write