OCZ Vector (256GB) Review
by Anand Lal Shimpi on November 27, 2012 9:10 PM ESTAnandTech Storage Bench 2011
Two years ago we introduced our AnandTech Storage Bench, a suite of benchmarks that took traces of real OS/application usage and played them back in a repeatable manner. I assembled the traces myself out of frustration with the majority of what we have today in terms of SSD benchmarks.
Although the AnandTech Storage Bench tests did a good job of characterizing SSD performance, they weren't stressful enough. All of the tests performed less than 10GB of reads/writes and typically involved only 4GB of writes specifically. That's not even enough exceed the spare area on most SSDs. Most canned SSD benchmarks don't even come close to writing a single gigabyte of data, but that doesn't mean that simply writing 4GB is acceptable.
Originally I kept the benchmarks short enough that they wouldn't be a burden to run (~30 minutes) but long enough that they were representative of what a power user might do with their system.
Not too long ago I tweeted that I had created what I referred to as the Mother of All SSD Benchmarks (MOASB). Rather than only writing 4GB of data to the drive, this benchmark writes 106.32GB. It's the load you'd put on a drive after nearly two weeks of constant usage. And it takes a *long* time to run.
1) The MOASB, officially called AnandTech Storage Bench 2011 - Heavy Workload, mainly focuses on the times when your I/O activity is the highest. There is a lot of downloading and application installing that happens during the course of this test. My thinking was that it's during application installs, file copies, downloading and multitasking with all of this that you can really notice performance differences between drives.
2) I tried to cover as many bases as possible with the software I incorporated into this test. There's a lot of photo editing in Photoshop, HTML editing in Dreamweaver, web browsing, game playing/level loading (Starcraft II & WoW are both a part of the test) as well as general use stuff (application installing, virus scanning). I included a large amount of email downloading, document creation and editing as well. To top it all off I even use Visual Studio 2008 to build Chromium during the test.
The test has 2,168,893 read operations and 1,783,447 write operations. The IO breakdown is as follows:
| AnandTech Storage Bench 2011 - Heavy Workload IO Breakdown | ||||
| IO Size | % of Total | |||
| 4KB | 28% | |||
| 16KB | 10% | |||
| 32KB | 10% | |||
| 64KB | 4% | |||
Only 42% of all operations are sequential, the rest range from pseudo to fully random (with most falling in the pseudo-random category). Average queue depth is 4.625 IOs, with 59% of operations taking place in an IO queue of 1.
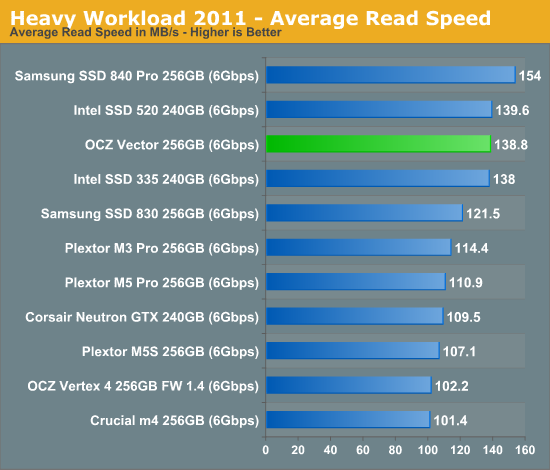
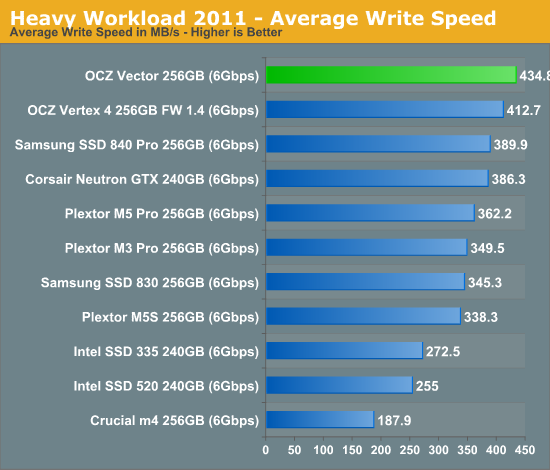
Many of you have asked for a better way to really characterize performance. Simply looking at IOPS doesn't really say much. As a result I'm going to be presenting Storage Bench 2011 data in a slightly different way. We'll have performance represented as Average MB/s, with higher numbers being better. At the same time I'll be reporting how long the SSD was busy while running this test. These disk busy graphs will show you exactly how much time was shaved off by using a faster drive vs. a slower one during the course of this test. Finally, I will also break out performance into reads, writes and combined. The reason I do this is to help balance out the fact that this test is unusually write intensive, which can often hide the benefits of a drive with good read performance.
There's also a new light workload for 2011. This is a far more reasonable, typical every day use case benchmark. Lots of web browsing, photo editing (but with a greater focus on photo consumption), video playback as well as some application installs and gaming. This test isn't nearly as write intensive as the MOASB but it's still multiple times more write intensive than what we were running in 2010.
As always I don't believe that these two benchmarks alone are enough to characterize the performance of a drive, but hopefully along with the rest of our tests they will help provide a better idea.
The testbed for Storage Bench 2011 has changed as well. We're now using a Sandy Bridge platform with full 6Gbps support for these tests.
AnandTech Storage Bench 2011 - Heavy Workload
We'll start out by looking at average data rate throughout our new heavy workload test:
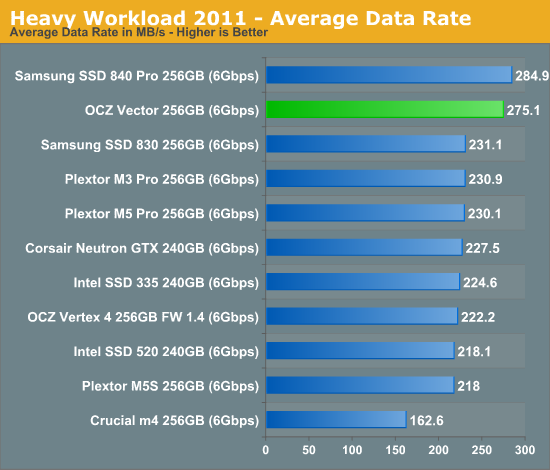
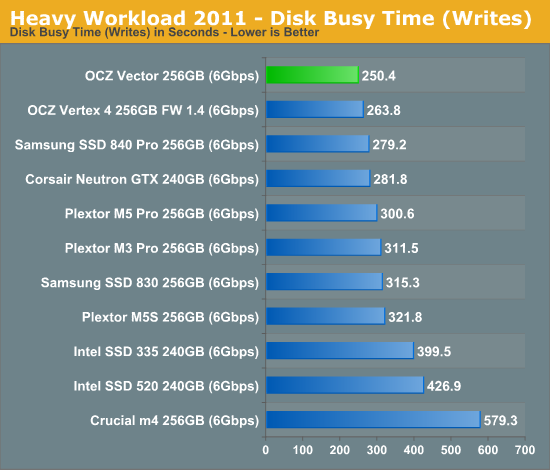
Here it is. OCZ's Vector comes within 4% of Samsung's SSD 840 Pro and manages a 22% increase in performance compared to the Vertex 4. The breakdown shows Vector's strong write performance are really what push it over the edge. At the same time, OCZ has finally addressed whatever poor read performance issues plagued the Vertex 4 in our test - the Vector is a different beast here.
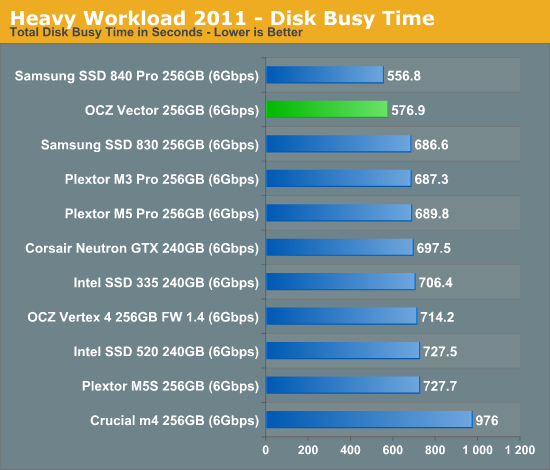
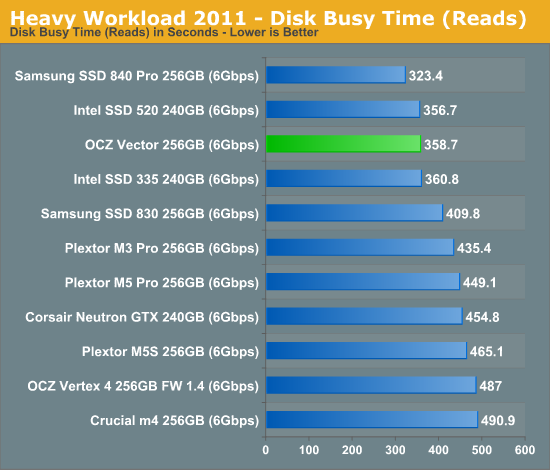
The next three charts just represent the same data, but in a different manner. Instead of looking at average data rate, we're looking at how long the disk was busy for during this entire test. Note that disk busy time excludes any and all idles, this is just how long the SSD was busy doing something:


151 Comments
View All Comments
extide - Wednesday, November 28, 2012 - link
Copy Performance is tied to the block size you use when reading and writing. IE if you read 4k at a time, then write 4k at a time, you will get different performance than reading 4MB at a time and then writing 4MB. So it largely depends on the specific app you are using. Copy isnt anything special, just reads and writes.mark53916 - Thursday, November 29, 2012 - link
Maybe I should have explained more:I have found that most USB keys and many SATA SSDs perform
MUCH worse (factor of 10 and even up to more than
300 decrease in performance) when reads and writes are mixed,
rather than being a bunch of reads followed by a bunch writes.
The reads and writes can be to random locations and there still
can be a big performance it.
A feel that a simple operating system copy of a large sequential
file and a tree of a bunch of smaller files should be done since
the two tests have shown me large performance differences
between two devices that have the about the same:
. sequential read rate
. sequential write rate
. Read/second
. Writes/second
when the reads and writes aren't mixed.
I also found that HD Tune Pro File Benchmark sometimes shows
significant (factor of 10 or more) differences between the
Sequential 4 KB random single and 4 KB random multi tests.
(For my own personal use, the best benchmark seems to be
copying a tree of my own data that has about 6GB in about
25000 files and copying from one 8GB TrueCrypt virtual disk
to another on the same device. I see differences of about
15 to one between stuff that I have tested in the last year
that all show speeds limited by my 7 year old motherboards
in sequential tests and all performing much slower with the
tree copy tests.
Since the tree is my ad-hoc data and my hardware is so old
I don't expect anyone to be able to duplicate the tests, but I
have given results in USENET groups that shows that there
are large performance differences that are not obviously
related to bottlenecks or slowness of my hardware.
There could be something complicated happening that
is due, for instance, in a problem with intermixing
read and write operations on USB 3 or SATA interface
that is dependent on the device under test but not
due to an inherent problem with the device under test,
but I think that the low performance for interleaved reads
and writes is at least 90% due to the device under test
and less than 10% due to problems with mixing
operations on my hardware since some devices don't
have a hit in performance when read and write operations
are mixed and have sequential uni-directional performance
much higher than 200MB/s on SATA and up to 134MB/s
on USB 3.
There could be some timing issues caused by having
a small number of buffers (much less than 1000), only
2 CPUs, having to wait for encryption, etc., but I don't
think these add up to a factor of 4, and, as I have said,
I see performance hits of much more than 15:1
for the same device, and all I did was switch from copying
from another flash device to the flash device under test
to copying from one location on the flash device under test
to another location. on the same device. Similarly, the
HD Tune Pro File Benchmark Sequential 4 KB random single
compared to 4 KB random multi with multi 4 or more
takes a hit of up to 100 for some USB 3 flash memory keys,
whereas other flash memory keys may run about the same speed
for random single and multi as well as about the same speed for
as the poorly performing device does for 4 KB random single.
MarchTheMonth - Wednesday, November 28, 2012 - link
Anand, I just want to know what you think of as a difference with the new CEO sending a formal, official compared to the hand-written notes by Ryan. To me (an outsider), official letters bore me, as they are just a carbon copy of the same letter sent to many others.A handwritten note would mean more to me. Now, given that the handwritten note was more of a nudge, I can understand that perhaps a less "nudging" note would be more appreciated, but I digress.
Just curious.
-March
BrightCandle - Wednesday, November 28, 2012 - link
Do you have more confidence this time that OCZ is actually being honest about the contents of their controller chip? Clearly last time you were concerned about OCZ's behaviour when you reviewed the Octane (both in terms of reviewing their drives and allowing them to advertise) and they out right lied to you about the contents of the chip, they lied to everyone until they got caught.This time do you think the leopard has changed its spots or is this just business as usual for a company that cheats so frequently?
gammaray - Wednesday, November 28, 2012 - link
The real question is,Why pay for an OCZ Vector when you can get a Samsung 840 Pro for the same price??
jwilliams4200 - Thursday, November 29, 2012 - link
Very good question.Hood6558 - Wednesday, November 28, 2012 - link
If these are priced to compete with Samsung's 840 Pro, only a die-hard OCZ fanboy would buy one, since the 840 Pro beats it in almost every benchmark, and is considered the most reliable brand, while OCZ has a long, rich history of failed drives, controllers, and firmware. Even if they were priced $50 below the Samsung I wouldn't buy one, at least not until they had 6 months under their belt without major issues. It get's old re-inventing your system every time your SSD has issues.SanX - Thursday, November 29, 2012 - link
Remember that excluding typed vs handwritten letter to Anand this is still 100% Ryan Petersen in each SSDskroh - Thursday, November 29, 2012 - link
I noticed that in the consistency testing, the Intel 330 seemed to outperform just about everything except the Intel 3700. That seems like a story worth exploring! Is the 330 a sleeper user-experience bargain?jwilliams4200 - Thursday, November 29, 2012 - link
For one thing, it did not look to me like the 330 had yet reached steady-state in the graphs provided. Maybe it had, but at the point where the graph cut-off things were still looking interesting.