OCZ Vector (256GB) Review
by Anand Lal Shimpi on November 27, 2012 9:10 PM ESTAnandTech Storage Bench 2011
Two years ago we introduced our AnandTech Storage Bench, a suite of benchmarks that took traces of real OS/application usage and played them back in a repeatable manner. I assembled the traces myself out of frustration with the majority of what we have today in terms of SSD benchmarks.
Although the AnandTech Storage Bench tests did a good job of characterizing SSD performance, they weren't stressful enough. All of the tests performed less than 10GB of reads/writes and typically involved only 4GB of writes specifically. That's not even enough exceed the spare area on most SSDs. Most canned SSD benchmarks don't even come close to writing a single gigabyte of data, but that doesn't mean that simply writing 4GB is acceptable.
Originally I kept the benchmarks short enough that they wouldn't be a burden to run (~30 minutes) but long enough that they were representative of what a power user might do with their system.
Not too long ago I tweeted that I had created what I referred to as the Mother of All SSD Benchmarks (MOASB). Rather than only writing 4GB of data to the drive, this benchmark writes 106.32GB. It's the load you'd put on a drive after nearly two weeks of constant usage. And it takes a *long* time to run.
1) The MOASB, officially called AnandTech Storage Bench 2011 - Heavy Workload, mainly focuses on the times when your I/O activity is the highest. There is a lot of downloading and application installing that happens during the course of this test. My thinking was that it's during application installs, file copies, downloading and multitasking with all of this that you can really notice performance differences between drives.
2) I tried to cover as many bases as possible with the software I incorporated into this test. There's a lot of photo editing in Photoshop, HTML editing in Dreamweaver, web browsing, game playing/level loading (Starcraft II & WoW are both a part of the test) as well as general use stuff (application installing, virus scanning). I included a large amount of email downloading, document creation and editing as well. To top it all off I even use Visual Studio 2008 to build Chromium during the test.
The test has 2,168,893 read operations and 1,783,447 write operations. The IO breakdown is as follows:
| AnandTech Storage Bench 2011 - Heavy Workload IO Breakdown | ||||
| IO Size | % of Total | |||
| 4KB | 28% | |||
| 16KB | 10% | |||
| 32KB | 10% | |||
| 64KB | 4% | |||
Only 42% of all operations are sequential, the rest range from pseudo to fully random (with most falling in the pseudo-random category). Average queue depth is 4.625 IOs, with 59% of operations taking place in an IO queue of 1.
Many of you have asked for a better way to really characterize performance. Simply looking at IOPS doesn't really say much. As a result I'm going to be presenting Storage Bench 2011 data in a slightly different way. We'll have performance represented as Average MB/s, with higher numbers being better. At the same time I'll be reporting how long the SSD was busy while running this test. These disk busy graphs will show you exactly how much time was shaved off by using a faster drive vs. a slower one during the course of this test. Finally, I will also break out performance into reads, writes and combined. The reason I do this is to help balance out the fact that this test is unusually write intensive, which can often hide the benefits of a drive with good read performance.
There's also a new light workload for 2011. This is a far more reasonable, typical every day use case benchmark. Lots of web browsing, photo editing (but with a greater focus on photo consumption), video playback as well as some application installs and gaming. This test isn't nearly as write intensive as the MOASB but it's still multiple times more write intensive than what we were running in 2010.
As always I don't believe that these two benchmarks alone are enough to characterize the performance of a drive, but hopefully along with the rest of our tests they will help provide a better idea.
The testbed for Storage Bench 2011 has changed as well. We're now using a Sandy Bridge platform with full 6Gbps support for these tests.
AnandTech Storage Bench 2011 - Heavy Workload
We'll start out by looking at average data rate throughout our new heavy workload test:
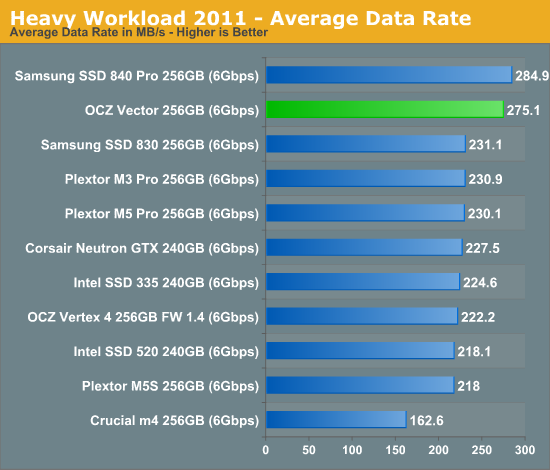
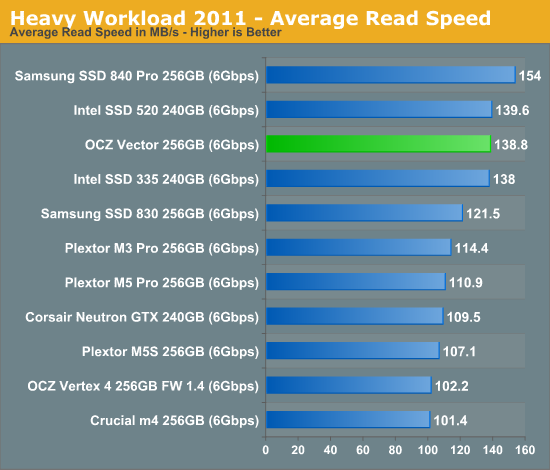
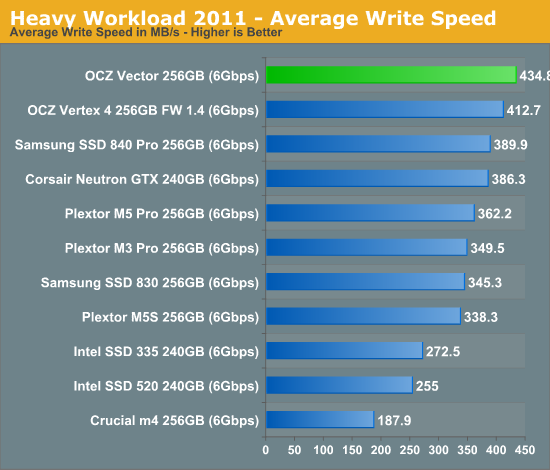
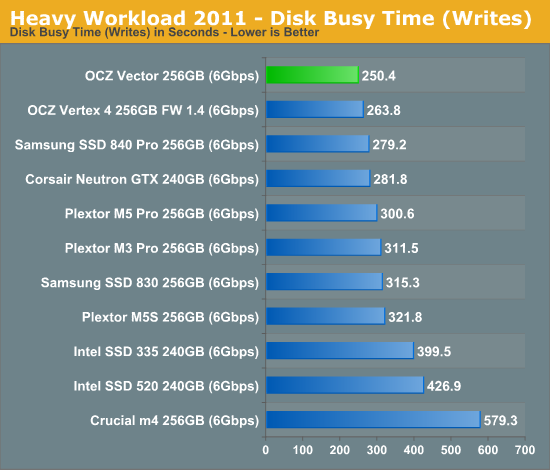
Here it is. OCZ's Vector comes within 4% of Samsung's SSD 840 Pro and manages a 22% increase in performance compared to the Vertex 4. The breakdown shows Vector's strong write performance are really what push it over the edge. At the same time, OCZ has finally addressed whatever poor read performance issues plagued the Vertex 4 in our test - the Vector is a different beast here.
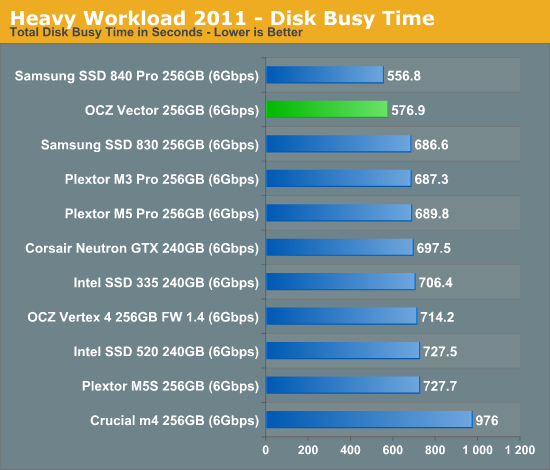
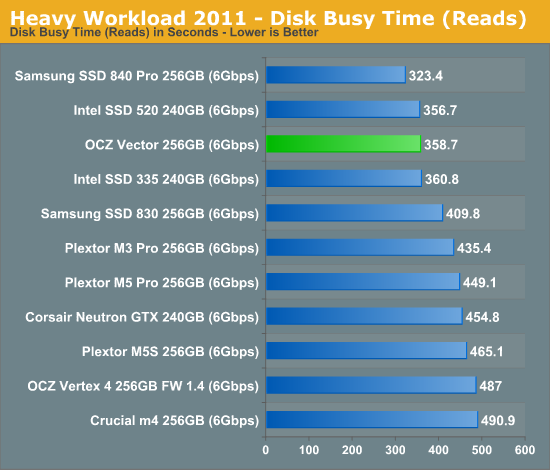
The next three charts just represent the same data, but in a different manner. Instead of looking at average data rate, we're looking at how long the disk was busy for during this entire test. Note that disk busy time excludes any and all idles, this is just how long the SSD was busy doing something:


151 Comments
View All Comments
Kristian Vättö - Wednesday, November 28, 2012 - link
Thanks for the heads up, I fixed the table.Death666Angel - Wednesday, November 28, 2012 - link
So, this drive costs as much as a 840 Pro (or a little less for the 512GB version) and has slightly worse performance in most cases. But if I use more than 50% of its capacity, I get much worse performance?That's something that bugged me in the Vertex 4 reviews: you test with the performance mode enabled in pretty much all graphs, but I will use it without it, because if I buy an SSD, I intend to use more than 50% of the drive.
I don't get it.
ocztony - Wednesday, November 28, 2012 - link
You ONLY see the slow down when you write to the whole of the drive in 1 go..so you will only ever see it if you sit running HDtach or a similar bench to the whole of the drive. The drive is actually intelligent, say you write a 4.7GB file for instance, it writes the data in a special way, more like an enhanced burst mode. Once writes have finished it then moves that written data to free up this fast write nand so its available again.It does this continually as you use the drive, if you are an average user writing say 15GB a day you will NEVER see a slow down.
Its a benchmark quirk and nothing more.
jwilliams4200 - Wednesday, November 28, 2012 - link
That is incorrect.The way it works is that in the STEADY STATE, performance mode is faster than storage mode. This should be obvious, because why would they even both having two modes if the steady state performance is not different between the modes?
Now, there is a temporary (but severe) slowdown when the drive switches from performance mode to storage mode, but I don't think that is what Death666Angel was talking about.
By the way, if you want a simple demonstration of the STEADY STATE speed difference between the modes, then secure erase the SSD, then use something like HD Tune to write to every LBA on the SSD. It will start out writing at speed S1, then around 50% or higher it will write at a lower speed, call it Sx. But that is only temporary. Give it a few minutes to complete the mode switch, then run the full drive write again. It will write at a constant speed over the drive, call it S2. But the key thing to notice is that S2 is LESS THAN S1. That is a demonstration that the steady-state performance is lower once the drive has been filled past 50% (or whatever percentage triggers the mode switch).
ocztony - Wednesday, November 28, 2012 - link
you do know who i am?I know how the drives work...you do not fully, im working on getting you info so you will know more.
jwilliams4200 - Wednesday, November 28, 2012 - link
Yes, I know who you are. You have posted incorrect information in the past. I have noticed on the OCZ forums that whatever makes OCZ or OCZ products look good is posted, whether true or not.I am talking about facts. Do you dispute what I wrote? Because hardocp measured exactly what I wrote here:
http://www.hardocp.com/article/2012/11/27/ocz_vect...
Besides, you did not address the elephant in the room. If there is no difference in speed between the two modes, than why do you have two modes, hmmm?
ocztony - Thursday, November 29, 2012 - link
Just for you..http://dl.dropbox.com/u/920660/vector/linear%20wri...
http://dl.dropbox.com/u/920660/vector/average%20wr...
In the end you do NOT fully understand how the drives work, you think you do, you do not. If a 100% write to all LBA test is run on the 128 and 256's you get what Anand shows, the reason for this is the drive is unable to move data around during the test. So...if you like running 100% LBA write tests to your drive all day them knock yourself out...buy the 512 and as you see it delivers right thru the LBA range. However if you just want to run the drive as an OS drive and you average a few GB writes per day, with coffee breaks and time away from the PC then the drive will continually recover and deliver full speed with low write access for every write you make to the drive right up till its full..the difference is you are not writing to 100% LBA in 1 go.
So what I said about it being a benchmark quirk is 100% correct, yes when you run that benchmark the 256's and 128's do slow up, however if you install an OS, and then load all your MP3's to the drive and it hist 70% of a 128 it may slow if it runs out of burst speed nand to write to BUT as soon as you finish writing it will recover..infact if you wrote the MP3's in 10GB chunks with a 1min pause between each write it would never slow down.
The drives are built to deliver with normal write usage patterns...you fail to see this though.
Maybe we need to give the option to turn the bust mode off and on, maybe then you will see the benefits.
ocztony - Thursday, November 29, 2012 - link
BTW the test was rin on an MSI 890FX with SB850, so an old sata3 AMD based platform...this is my work station. The drive is much faster on an Intel platform due tot he AMD sata controller not being as fast.jwilliams4200 - Thursday, November 29, 2012 - link
And you completely failed to answer either of the questions I posed.It seems to me that you do not understand how your own SSDs work, and you are unable to explain.
ocztony - Thursday, November 29, 2012 - link
I show you a vector with no slow down, same write access latency for 100% LBA and explain why the 2 other capacity drives work the way they do and its still not good enough.
Come to my forum, ask what you want and we will do everything we can to answer every question within the realms of not disclosing any IP we have to protect.
In fact Jwilliams email me at tony_@_ocztechnology.com without the _ and I will forward an NDA to you, sign it and get it back to me and I will call you and explain exactly how the drives work..you will then know.