OCZ Vector (256GB) Review
by Anand Lal Shimpi on November 27, 2012 9:10 PM ESTAnandTech Storage Bench 2011
Two years ago we introduced our AnandTech Storage Bench, a suite of benchmarks that took traces of real OS/application usage and played them back in a repeatable manner. I assembled the traces myself out of frustration with the majority of what we have today in terms of SSD benchmarks.
Although the AnandTech Storage Bench tests did a good job of characterizing SSD performance, they weren't stressful enough. All of the tests performed less than 10GB of reads/writes and typically involved only 4GB of writes specifically. That's not even enough exceed the spare area on most SSDs. Most canned SSD benchmarks don't even come close to writing a single gigabyte of data, but that doesn't mean that simply writing 4GB is acceptable.
Originally I kept the benchmarks short enough that they wouldn't be a burden to run (~30 minutes) but long enough that they were representative of what a power user might do with their system.
Not too long ago I tweeted that I had created what I referred to as the Mother of All SSD Benchmarks (MOASB). Rather than only writing 4GB of data to the drive, this benchmark writes 106.32GB. It's the load you'd put on a drive after nearly two weeks of constant usage. And it takes a *long* time to run.
1) The MOASB, officially called AnandTech Storage Bench 2011 - Heavy Workload, mainly focuses on the times when your I/O activity is the highest. There is a lot of downloading and application installing that happens during the course of this test. My thinking was that it's during application installs, file copies, downloading and multitasking with all of this that you can really notice performance differences between drives.
2) I tried to cover as many bases as possible with the software I incorporated into this test. There's a lot of photo editing in Photoshop, HTML editing in Dreamweaver, web browsing, game playing/level loading (Starcraft II & WoW are both a part of the test) as well as general use stuff (application installing, virus scanning). I included a large amount of email downloading, document creation and editing as well. To top it all off I even use Visual Studio 2008 to build Chromium during the test.
The test has 2,168,893 read operations and 1,783,447 write operations. The IO breakdown is as follows:
| AnandTech Storage Bench 2011 - Heavy Workload IO Breakdown | ||||
| IO Size | % of Total | |||
| 4KB | 28% | |||
| 16KB | 10% | |||
| 32KB | 10% | |||
| 64KB | 4% | |||
Only 42% of all operations are sequential, the rest range from pseudo to fully random (with most falling in the pseudo-random category). Average queue depth is 4.625 IOs, with 59% of operations taking place in an IO queue of 1.
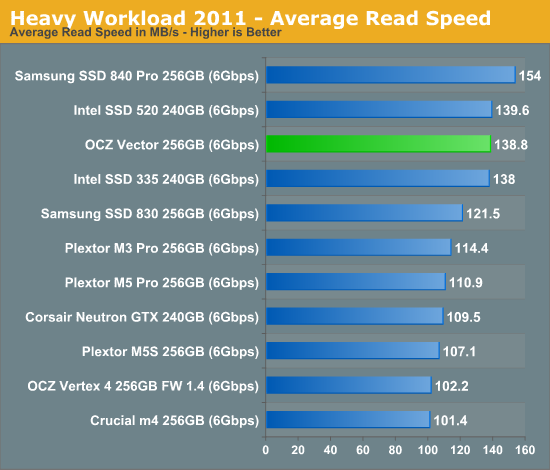
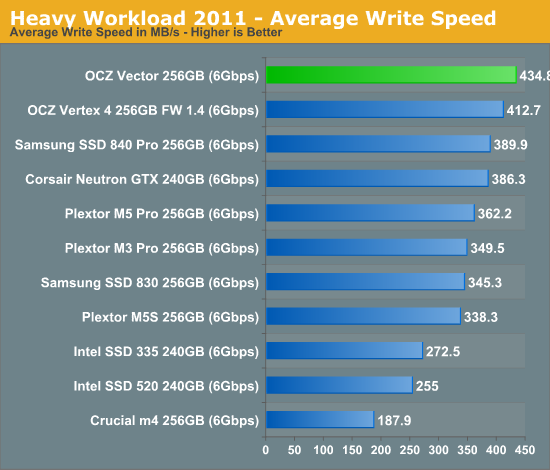
Many of you have asked for a better way to really characterize performance. Simply looking at IOPS doesn't really say much. As a result I'm going to be presenting Storage Bench 2011 data in a slightly different way. We'll have performance represented as Average MB/s, with higher numbers being better. At the same time I'll be reporting how long the SSD was busy while running this test. These disk busy graphs will show you exactly how much time was shaved off by using a faster drive vs. a slower one during the course of this test. Finally, I will also break out performance into reads, writes and combined. The reason I do this is to help balance out the fact that this test is unusually write intensive, which can often hide the benefits of a drive with good read performance.
There's also a new light workload for 2011. This is a far more reasonable, typical every day use case benchmark. Lots of web browsing, photo editing (but with a greater focus on photo consumption), video playback as well as some application installs and gaming. This test isn't nearly as write intensive as the MOASB but it's still multiple times more write intensive than what we were running in 2010.
As always I don't believe that these two benchmarks alone are enough to characterize the performance of a drive, but hopefully along with the rest of our tests they will help provide a better idea.
The testbed for Storage Bench 2011 has changed as well. We're now using a Sandy Bridge platform with full 6Gbps support for these tests.
AnandTech Storage Bench 2011 - Heavy Workload
We'll start out by looking at average data rate throughout our new heavy workload test:
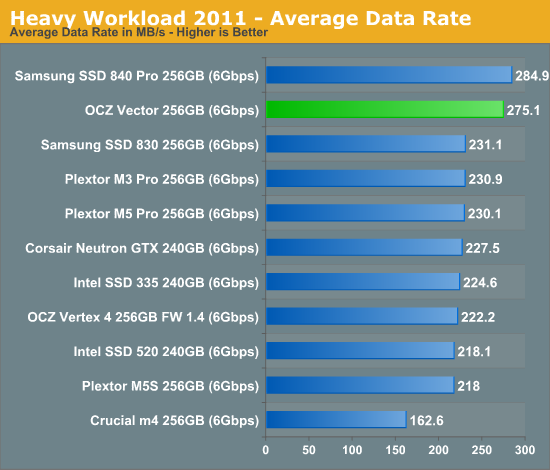
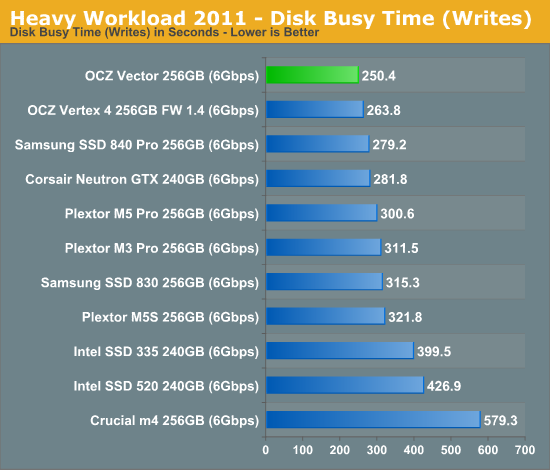
Here it is. OCZ's Vector comes within 4% of Samsung's SSD 840 Pro and manages a 22% increase in performance compared to the Vertex 4. The breakdown shows Vector's strong write performance are really what push it over the edge. At the same time, OCZ has finally addressed whatever poor read performance issues plagued the Vertex 4 in our test - the Vector is a different beast here.
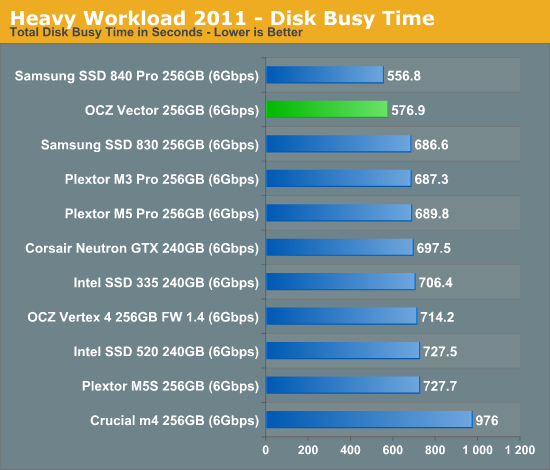
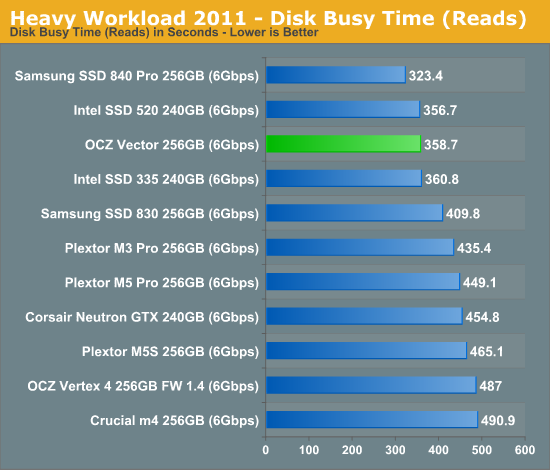
The next three charts just represent the same data, but in a different manner. Instead of looking at average data rate, we're looking at how long the disk was busy for during this entire test. Note that disk busy time excludes any and all idles, this is just how long the SSD was busy doing something:


151 Comments
View All Comments
Anand Lal Shimpi - Wednesday, November 28, 2012 - link
The write amount does actually scale with capacity, OCZ just tried to simplify things with how they presented the data here. In actuality, even the smallest capacity Vector should be good for more than 20GB of host writes per day x 5 years.Take care,
Anand
jwilliams4200 - Wednesday, November 28, 2012 - link
Wait, what? I thought OCZ claimed the warranty was the same for all capacities, 5 years of 36TB, whichever comes first.Are you saying that the 36TB number is only for the 128GB Vector, and the other two have double and quadruple that amount allowed before the warranty runs out?
Kristian Vättö - Wednesday, November 28, 2012 - link
OCZ only says 20GB of writes a day for 5 years in the Vector datasheet, no capacity differentiation:http://www.ocztechnology.com/res/manuals/OCZ_Vecto...
JellyRoll - Wednesday, November 28, 2012 - link
These endurance tests that they use to generate the predicted life of the SSD are with 100% fill and full span random writes. This prevents the SSD from doing many of the internal tasks as efficiently that reduce write amplification. You would need to be doing full span random writes to see these types of endurance numbers.Free capacity on the drive, and different types of data other than 4K random will result in much higher endurance.
These numbers are intentionally worst case scenarios.
A5 - Wednesday, November 28, 2012 - link
If your usage case is saturating a Gigabit connection 24/7, you need to be buying SLC Enterprise drives (and get a better network connection :P).36TB doesn't sound like much if you're making up crazy scenarios, but that is probably near a decade of use for a normal power-user. Another way to put it is that you'd have to re-install a 12GB game 3,000 times to get that number..
seapeople - Sunday, December 2, 2012 - link
But if you reinstall a 12GB game four times per day, and eight times on a Saturday, then your drive could be worn out after just three months!It's a reasonable use case for someone who only wants to spring for the budget 40GB SSD, but still wants to oscillate between playing four large games on a daily basis.
jwilliams4200 - Monday, December 3, 2012 - link
Your math is off. That is only 713GB.jwilliams4200 - Monday, December 3, 2012 - link
Oops, my math is off, too. But yours is still off.3 months is 13 weeks, so 13 Saturdays and 78 non-Saturdays.
12*(4*78 + 8*13) = 4992GB
So you have to do that 7.2 more times to get to 36TB, which is about 1.8 years.
jeff3206 - Wednesday, November 28, 2012 - link
Vertex, Octane, Agility, Synapse, Revodrive, Z-Drive, Velodrive and now Vector, plus an array of generation numbers and suffixes. Could OCZ's flash product naming system be any more complicated?Numerical product names may not be sexy, but they sure are easy to understand.
wpcoe - Wednesday, November 28, 2012 - link
Chart on first page of review shows Sequential Write speed for 128GB model as 530MB/s, when the OCZ site (http://www.ocztechnology.com/vector-series-sata-ii... shows it as 400MB/s.