OCZ Vector (256GB) Review
by Anand Lal Shimpi on November 27, 2012 9:10 PM ESTPerformance Consistency
In our Intel SSD DC S3700 review I introduced a new method of characterizing performance: looking at the latency of individual operations over time. The S3700 promised a level of performance consistency that was unmatched in the industry, and as a result needed some additional testing to show that. The reason we don't have consistent IO latency with SSDs is because inevitably all controllers have to do some amount of defragmentation or garbage collection in order to continue operating at high speeds. When and how an SSD decides to run its defrag and cleanup routines directly impacts the user experience. Frequent (borderline aggressive) cleanup generally results in more stable performance, while delaying that can result in higher peak performance at the expense of much lower worst case performance. The graphs below tell us a lot about the architecture of these SSDs and how they handle internal defragmentation.
To generate the data below I took a freshly secure erased SSD and filled it with sequential data. This ensures that all user accessible LBAs have data associated with them. Next I kicked off a 4KB random write workload at a queue depth of 32 using incompressible data. I ran the test for just over half an hour, no where near what we run our steady state tests for but enough to give me a good look at drive behavior once all spare area filled up.
I recorded instantaneous IOPS every second for the duration of the test. I then plotted IOPS vs. time and generated the scatter plots below. Each set of graphs features the same scale. The first two sets use a log scale for easy comparison, while the last set of graphs uses a linear scale that tops out at 40K IOPS for better visualization of differences between drives.
The first set of graphs shows the performance data over the entire 2000 second test period. In these charts you'll notice an early period of very high performance followed by a sharp dropoff. What you're seeing in that case is the drive alllocating new blocks from its spare area, then eventually using up all free blocks and having to perform a read-modify-write for all subsequent writes (write amplification goes up, performance goes down).
The second set of graphs zooms in to the beginning of steady state operation for the drive (t=1400s). The third set also looks at the beginning of steady state operation but on a linear performance scale. Click the buttons below each graph to switch source data.
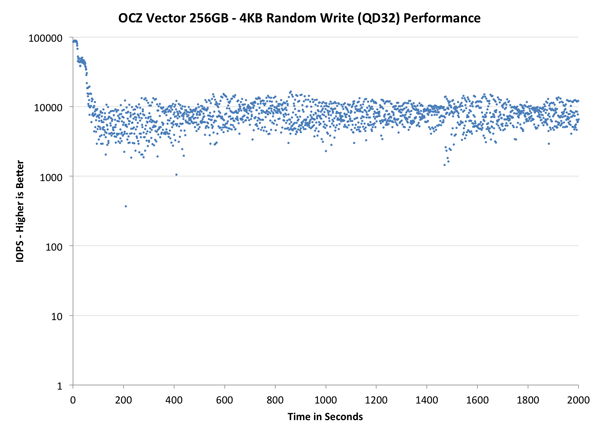
Here we see a lot of the code re-use between the Vector and Vertex 4 firmware. Vector performs like a faster Vertex 4, with all of its datapoints shifted up in the graph. The distribution of performance is a bit tighter than on the Vertex 4 and performance is definitely more consistent than the 840 Pro. The S3700 is obviously in a league of its own here, but I do hope that over time we'll see similarly consistent drives from other vendors.
The next set of charts look at the steady state (for most drives) portion of the curve. Here we'll get some better visibility into how everyone will perform over the long run.
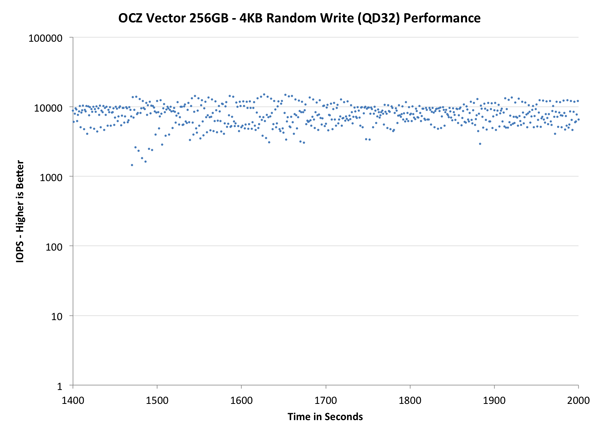
The source data is the same, we're just focusing on a different part of the graph. Here the Vector actually looks pretty good compared to all non-S3700 drives. In this case the Vector's performance distribution looks a lot like SandForce. There's a clear advantage again over the 840 Pro and Vertex 4.
The final set of graphs abandons the log scale entirely and just looks at a linear scale that tops out at 40K IOPS. We're also only looking at steady state (or close to it) performance here:
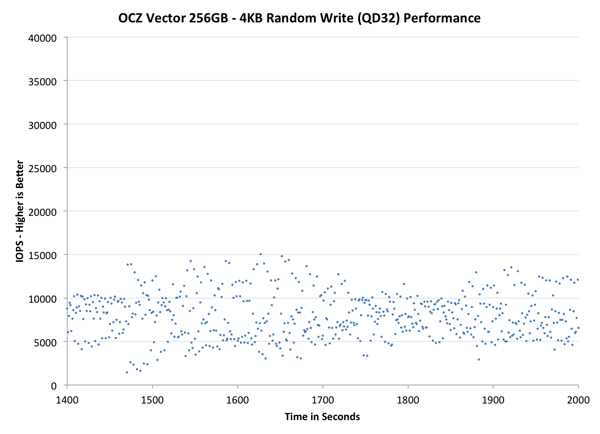
If we look at the tail end of the graph with a linear scale, we get a taste of the of just how varied IO latency can be with most of these drives. Vector looks much more spread out than the Vertex 4, but that's largely a function of the fact that its performance is just so much higher without an equivalent increase in aggressive defrag/GC routines. The 840 Pro generally manages lower performance in this worst case scenario. The SandForce based Intel SSD 330 shows a wide range of IO latencies but overall performance is much better. Had SandForce not been plagued by so many poorly handled reliability issues it might have been a better received option today.
From an IO consistency perspective, the Vector looks a lot like a better Vertex 4 or 840 Pro. Architecturally I wouldn't be too surprised if OCZ's method of NAND mapping and flash management wasn't very similar to Samsung's, which isn't a bad thing at all. I would like to see more emphasis placed on S3700-style IO consistency though. I do firmly believe that the first company to deliver IO consistency for the client space will reap serious rewards.


151 Comments
View All Comments
Anand Lal Shimpi - Wednesday, November 28, 2012 - link
The write amount does actually scale with capacity, OCZ just tried to simplify things with how they presented the data here. In actuality, even the smallest capacity Vector should be good for more than 20GB of host writes per day x 5 years.Take care,
Anand
jwilliams4200 - Wednesday, November 28, 2012 - link
Wait, what? I thought OCZ claimed the warranty was the same for all capacities, 5 years of 36TB, whichever comes first.Are you saying that the 36TB number is only for the 128GB Vector, and the other two have double and quadruple that amount allowed before the warranty runs out?
Kristian Vättö - Wednesday, November 28, 2012 - link
OCZ only says 20GB of writes a day for 5 years in the Vector datasheet, no capacity differentiation:http://www.ocztechnology.com/res/manuals/OCZ_Vecto...
JellyRoll - Wednesday, November 28, 2012 - link
These endurance tests that they use to generate the predicted life of the SSD are with 100% fill and full span random writes. This prevents the SSD from doing many of the internal tasks as efficiently that reduce write amplification. You would need to be doing full span random writes to see these types of endurance numbers.Free capacity on the drive, and different types of data other than 4K random will result in much higher endurance.
These numbers are intentionally worst case scenarios.
A5 - Wednesday, November 28, 2012 - link
If your usage case is saturating a Gigabit connection 24/7, you need to be buying SLC Enterprise drives (and get a better network connection :P).36TB doesn't sound like much if you're making up crazy scenarios, but that is probably near a decade of use for a normal power-user. Another way to put it is that you'd have to re-install a 12GB game 3,000 times to get that number..
seapeople - Sunday, December 2, 2012 - link
But if you reinstall a 12GB game four times per day, and eight times on a Saturday, then your drive could be worn out after just three months!It's a reasonable use case for someone who only wants to spring for the budget 40GB SSD, but still wants to oscillate between playing four large games on a daily basis.
jwilliams4200 - Monday, December 3, 2012 - link
Your math is off. That is only 713GB.jwilliams4200 - Monday, December 3, 2012 - link
Oops, my math is off, too. But yours is still off.3 months is 13 weeks, so 13 Saturdays and 78 non-Saturdays.
12*(4*78 + 8*13) = 4992GB
So you have to do that 7.2 more times to get to 36TB, which is about 1.8 years.
jeff3206 - Wednesday, November 28, 2012 - link
Vertex, Octane, Agility, Synapse, Revodrive, Z-Drive, Velodrive and now Vector, plus an array of generation numbers and suffixes. Could OCZ's flash product naming system be any more complicated?Numerical product names may not be sexy, but they sure are easy to understand.
wpcoe - Wednesday, November 28, 2012 - link
Chart on first page of review shows Sequential Write speed for 128GB model as 530MB/s, when the OCZ site (http://www.ocztechnology.com/vector-series-sata-ii... shows it as 400MB/s.