ASUS F1A75-I Deluxe Review – Llano and Mini-ITX
by Ian Cutress on October 1, 2011 5:30 PM EST- Posted in
- Motherboards
- Asus
- A75
Test Setup
| Processor |
AMD Llano A6-3650 4 Cores, 4 Threads, 2.6 GHz |
| Motherboards | ASUS F1A75-I Deluxe |
| Cooling | Corsair H50-1 |
| Power Supply | Silverstone 1000W 80 PLUS Silver |
| Memory |
G.Skill RipjawsX DDR3-1866 9-10-9 28 2x4GB Kit 1.5V Patriot Viper Xtreme DDR3-2133 9-11-9 27 2x4 GB Kit 1.65V |
| Memory Settings | DDR3-1866 |
| Video Cards |
XFX HD 5850 1GB ECS GTX 580 1536MB |
| Video Drivers |
Catalyst 10.12 / 11.8 NVIDIA Drivers 280.26 |
| Hard Drive |
Micron RealSSD C300 256GB OCZ Vertex3 240GB |
| Optical Drive | LG GH22NS50 |
| Case | Open Test Bed - CoolerMaster Lab V1.0 |
| Operating System | Windows 7 64-bit |
| SATA Testing |
Micron RealSSD C300 256GB OCZ Vertex3 240GB |
| USB 2/3 Testing | Patriot 64GB SuperSonic USB 3.0 |
As part of our test setup, we are slowly migrating to newer drivers for our discrete GPU tests, as well as updating the tests appropriately. However, as it is only fair to test like for like, comparisons will only be made with results achieved with the same drivers.
Comparison to Other Reviews
Where applicable, the results in this review are directly compared to the following chipsets and boards which we have reviewed previously:
Note: The main comparison point for the ASUS F1A75-I Deluxe for us is the ASRock A75 Extreme6 we have already tested. As a result of that review, which was run with DDR3-1333 settings to compare to Sandy Bridge boards, I have been asked to run future Llano reviews at DDR3-1866, which Llano supports natively. For logistical reasons, there is also a CPU discrepancy, where today we are using an A6-3650 (2.6 GHz, 320 SP IGP), and in the A75 Extreme6, an A8-3850 (2.9 GHz, 400 SP IGP) was used. In analysing the results, these factors will be taken into account.
Power Consumption
Power consumption was tested on the system as a whole with a wall meter connected to the power supply, while in a dual GPU configuration. This method allows us to compare the power management of the UEFI and the board to supply components with power under load, and includes typical PSU losses due to efficiency. These are the real world values that consumers may expect from a typical system (minus the monitor) using this motherboard.
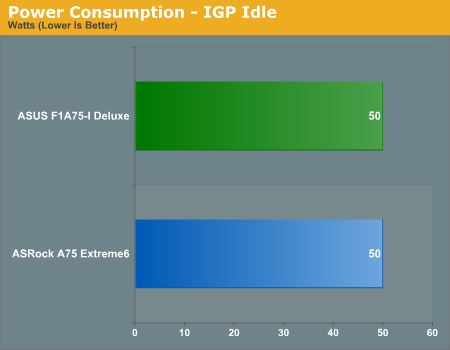
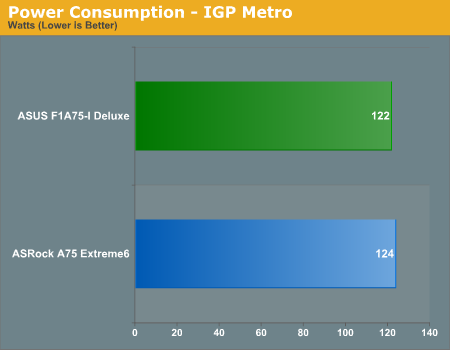
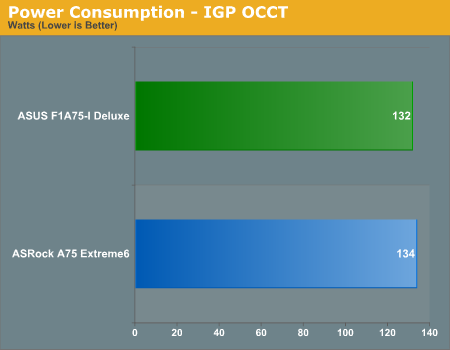
The only board to compare the F1A75-I Deluxe to is the A75 Extreme6 board I reviewed a few months ago. Both boards perform similarly.
CPU Temperatures
With most users running their boards on purely default BIOS settings, we are running at default settings for the CPU temperature tests. This is, in our outward view, an indication of how well (or how adventurous) the vendor has their BIOS configured on automatic settings. With a certain number of vendors not making CPU voltage, turbo voltage or LLC options configurable to the end user, which would directly affect power consumption and CPU temperatures at various usage levels, we find the test appropriate for the majority of cases. This does conflict somewhat with some vendors' methodology of providing a list of 'suggested' settings for reviewers to use. But unless those settings being implemented automatically for the end user, all these settings do for us it attempt to skew the results, and thus provide an unbalanced 'out of the box' result list to the readers who will rely on those default settings to make a judgment.
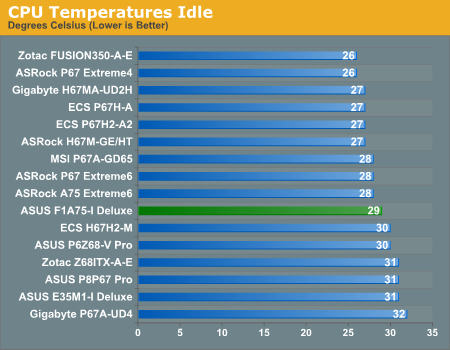
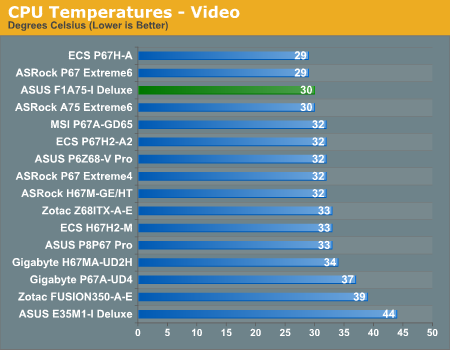
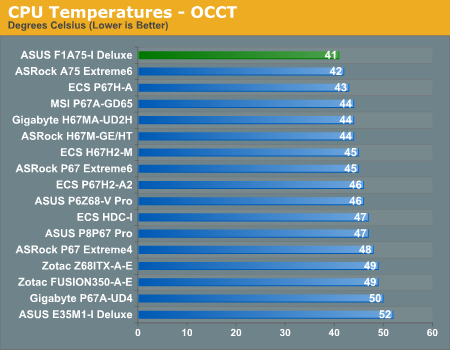
Compared to the board we have tested, the F1A75 Deluxe does well on CPU temperatures, even compared to the low powered Fusion boards with passive cooling, and the Sandy Bridge boards.


51 Comments
View All Comments
jensend - Sunday, October 2, 2011 - link
You're totally wrong. The 80 Plus standard tells you how efficient the PSU is at 20%, 50%, and 100% of its rated capacity. PSUs are usually most efficient at around 2/3 of their capacity, and though they can be almost as efficient at full load, efficiency inevitably drops off sharply for loads which are ~15% of the full load or below.For a 1KW PSU like the one used in the review, they only had to meet efficiency targets at 200W to get certified; it's probably operating at only ~60% efficiency when these machines are idling at around 30W. Even an 80 Plus Platinum 1000W PSU is likely to be no more efficient than a non-80 Plus-certified 300W PSU for the sub-100 wattages most computers use most of the time.
The 80 Plus certification program is badly designed. Too many people think they're getting an efficient PSU when the PSU is only efficient at wattages they'll never use, and manufacturers make more high wattage PSUs because it is easier to be high efficiency and get certified at ridiculously high wattages.
nubie - Sunday, October 2, 2011 - link
Exactly, the only way to be sure what the BOARD draw is would be to measure the 12v 3.3v and 5v lines going to the board.Re $119 deal, I don't think that is available to anyone anymore, $139 for just that processor on Newegg.
Nforce graphics are notoriously power hungry, I should know I have had half a dozen of them. That comparison is silly.
Did you try the true Dual Core AMD without the latency-adding L3 cache? The Athlon II x2 2x1MB Lvl 2 models are decent. You can find them for around $35 if you keep a lookout, I wouldn't knock it.
The 5 watts you may potentially save is nothing compared to what your monitor or an inefficient sound system may draw.
hp79 - Monday, October 3, 2011 - link
Yeah, before I upgraded the AMD system to X3 last year, it had a AMD BE 2300 in it. It sucked around 40W at the time and I was happy about the power consumption. But the thing was too slow even for normal web surf and stuff so I upgraded the CPU.I know the 80 Plus does not mean it's all-the-way 80% or more efficient. I was thinking that it can't be that far off even if it is at 10% load. In this case, it's even lower than that, and thinking again, it does make a lot of difference in such a small load.
Comparing this AMD system again with Intel Sandy Bridge system, unless you need to play games with so-so graphics of Llano, I don't think it's worth it to use it for HTPC usage. I read reviews that idling at 20W is normal for Sandy Bridge systems. I believe my desktop power usage will also drop to those levels if I take off my GTX 460 graphics card. Sure, if it was 5W we are talking about, it's not a big deal. But 50W AMD vs 20W Intel is a lot. Yes, I agree the test is flawed so they should redo the test using a lower wattage PSU.
Death666Angel - Monday, October 3, 2011 - link
Just a quick info: my HTPC build with these components:60W pico psu
AsRock A75M-ITX
A6-3500 (triple core)
2*2GB 1866MHZ (8/8/8/T1)
500GB 2.5" HDD Toshiba (still need a MicroSATA adapter for my 1.8" SSD)
draws ~51W when using Linx with 3 threads (it goes to P0 with 2.1GHZ). It draws ~56W when I set P0 as the B0 with 2.4GHz. With medium activity (web browsing while installing windows updates) I get ~35W. In idle I have between ~25W and ~30W.
Btw. this is all with K10Stat lowering the votlages by betwem .2V (P6,P5), .3 (P4) and .4V (P3-P0 and B0). Which is kinda ridiculous and makes you wonder if AMD did this on purpose to not conflict with their Brazos line....
Anyway, I think those voltages are pretty sweet.
jensend - Tuesday, October 4, 2011 - link
What case are you using? I'm planning on doing a very similar build (though with a higher capacity picopsu) and I'm having trouble settling on a case.Roland00Address - Sunday, October 2, 2011 - link
1) The item to my understanding is not on the market yet. Made more evident via an estimated price instead of a real one.2) Uses a pre-release bios
3) Item was shipped via ASUS, when previous we were told via Anandtech motherboard reviews (not neccessary other items such as laptops) would be bought on the open market.
We were told these policies were going to be implemented due to the disaster that was testing on the x58 roundup less than 3 years ago.
I do appreciate this article and I enjoyed reading it, but I believe it should be called a preview and not a review.
Nihility - Sunday, October 2, 2011 - link
It would be nice to know how long it takes EFI on different motherboards to finish loading.Especially with Windows 8 and its faster boot speed, it's an important metric.
Some older BIOSes when set to AHCI and RAID would take 20 seconds to load, I'd like to be able to avoid such products in the future.
Death666Angel - Sunday, October 2, 2011 - link
Why?All that really counts is that you can see how component x (ASUS mini ITX) fares against a competing component y (AsRock ATX), so you can make the decision what is better for your usage model. This standardized test setup delivers that. It does not show the performance, power consumption etc. that you will see at home, but it does show the difference between different components.
If this motherboards draws more power vs. the other tested FM1 from AsRock, it is true to say that the same would be true for you at home, same thing with different performance deltas.
I think this is the best setup if you want the biggest overall comparison size while still not devoting all your time. Because time really is the #1 constraint here.
AnandThenMan - Sunday, October 2, 2011 - link
You're just making excuses. Other sites are using proper better testing methods, what is the problem here? No one, and I mean no one, is going to pair this system with a 1000 watt power supply, and I don't know about you, but I like to read reviews that reflect how a typical system is actually going to be configured and used.Death666Angel - Monday, October 3, 2011 - link
I would like that as well, but I understand the time constraints behind it, because testing every system according to their usage will mean testing every system at least 2 to 3 times. This ITX mainboard could be used in a HTPC with a pico PSU, but it could also be used in a Lian Li case with 6 3.5" HDDs for a selfmade mini-NAS, which would need more power. You would also need to test other motherboards with this little pico PSU, because otherwise you cannot compare the motherboards to one another.In a perfect world, we would have 5 different setups for this motherboard, the HTPC with pico PSU and undervolted. The HTPC with a pico PSU and an additional graphics card. The mini-NAS with 5-8 3.5" HDDs. The gamer PC with a powerful graphics card and overclocked CPU. And maybe the 5th can be overclocked CPU with pico PSU as HTPC with better decoding capabilities.
Every one of those usages probably has readers who are interested in it. And then you would need to have all those test setups applied to every other FM1 motherboard or else you cannot decide which one uses the least power, has the best overclock etc. You see the problem you start running into without a few standardized test setups?
I'm not making excuses, why would I? I have no affiliation to this website and am just a reader.