The OCZ Vertex 3 Review (120GB)
by Anand Lal Shimpi on April 6, 2011 6:32 PM ESTAnandTech Storage Bench 2011
I didn't expect to have to debut this so soon, but I've been working on updated benchmarks for 2011. Last year we introduced our AnandTech Storage Bench, a suite of benchmarks that took traces of real OS/application usage and played them back in a repeatable manner. I assembled the traces myself out of frustration with the majority of what we have today in terms of SSD benchmarks.
Although the AnandTech Storage Bench tests did a good job of characterizing SSD performance, they weren't stressful enough. All of the tests performed less than 10GB of reads/writes and typically involved only 4GB of writes specifically. That's not even enough exceed the spare area on most SSDs. Most canned SSD benchmarks don't even come close to writing a single gigabyte of data, but that doesn't mean that simply writing 4GB is acceptable.
Originally I kept the benchmarks short enough that they wouldn't be a burden to run (~30 minutes) but long enough that they were representative of what a power user might do with their system.
Not too long ago I tweeted that I had created what I referred to as the Mother of All SSD Benchmarks (MOASB). Rather than only writing 4GB of data to the drive, this benchmark writes 106.32GB. It's the load you'd put on a drive after nearly two weeks of constant usage. And it takes a *long* time to run.
I'll be sharing the full details of the benchmark in some upcoming SSD articles but here are some details:
1) The MOASB, officially called AnandTech Storage Bench 2011 - Heavy Workload, mainly focuses on the times when your I/O activity is the highest. There is a lot of downloading and application installing that happens during the course of this test. My thinking was that it's during application installs, file copies, downloading and multitasking with all of this that you can really notice performance differences between drives.
2) I tried to cover as many bases as possible with the software I incorporated into this test. There's a lot of photo editing in Photoshop, HTML editing in Dreamweaver, web browsing, game playing/level loading (Starcraft II & WoW are both a part of the test) as well as general use stuff (application installing, virus scanning). I included a large amount of email downloading, document creation and editing as well. To top it all off I even use Visual Studio 2008 to build Chromium during the test.
Update: As promised, some more details about our Heavy Workload for 2011.
The test has 2,168,893 read operations and 1,783,447 write operations. The IO breakdown is as follows:
| AnandTech Storage Bench 2011 - Heavy Workload IO Breakdown | ||||
| IO Size | % of Total | |||
| 4KB | 28% | |||
| 16KB | 10% | |||
| 32KB | 10% | |||
| 64KB | 4% | |||
Only 42% of all operations are sequential, the rest range from pseudo to fully random (with most falling in the pseudo-random category). Average queue depth is 4.625 IOs, with 59% of operations taking place in an IO queue of 1.
Many of you have asked for a better way to really characterize performance. Simply looking at IOPS doesn't really say much. As a result I'm going to be presenting Storage Bench 2011 data in a slightly different way. We'll have performance represented as Average MB/s, with higher numbers being better. At the same time I'll be reporting how long the SSD was busy while running this test. These disk busy graphs will show you exactly how much time was shaved off by using a faster drive vs. a slower one during the course of this test. Finally, I will also break out performance into reads, writes and combined. The reason I do this is to help balance out the fact that this test is unusually write intensive, which can often hide the benefits of a drive with good read performance.
There's also a new light workload for 2011. This is a far more reasonable, typical every day use case benchmark. Lots of web browsing, photo editing (but with a greater focus on photo consumption), video playback as well as some application installs and gaming. This test isn't nearly as write intensive as the MOASB but it's still multiple times more write intensive than what we were running last year.
As always I don't believe that these two benchmarks alone are enough to characterize the performance of a drive, but hopefully along with the rest of our tests they will help provide a better idea.
The testbed for Storage Bench 2011 has changed as well. We're now using a Sandy Bridge platform with full 6Gbps support for these tests. All of the older tests are still run on our X58 platform.
AnandTech Storage Bench 2011 - Heavy Workload
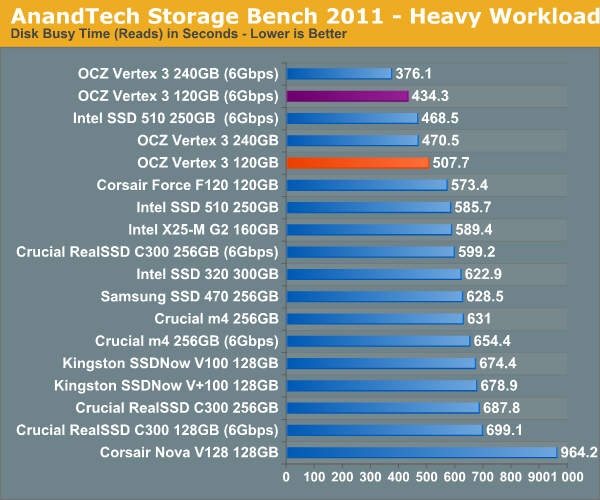
We'll start out by looking at average data rate throughout our new heavy workload test:
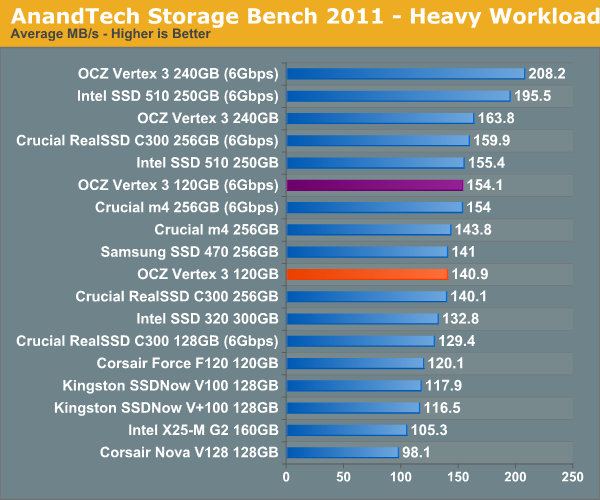
In our heavy test for 2011 the 120GB Vertex 3 is noticeably slower than the 240GB sample we tested a couple of months ago. Fewer available die are the primary explanation. We're still waiting on samples of the 120GB Intel SSD 320 and the Crucial m4 but it's looking like this round will be more competitive than we originally thought.
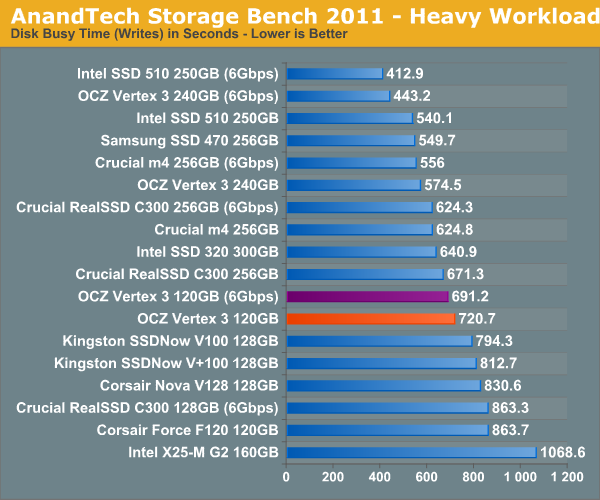
The breakdown of reads vs. writes tells us more of what's going on:
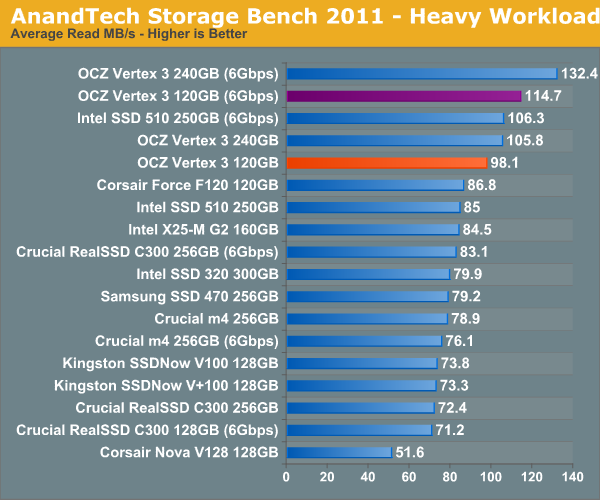
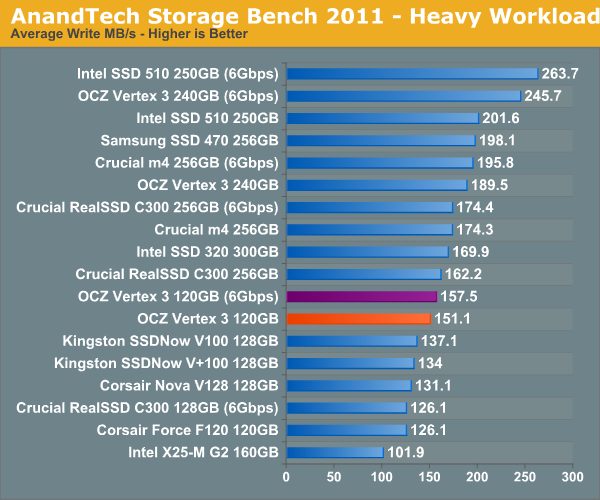
Surprisingly enough it's not read speed that holds the 120GB Vertex 3 back, it's ultimately the lower (incompressible) write speed:
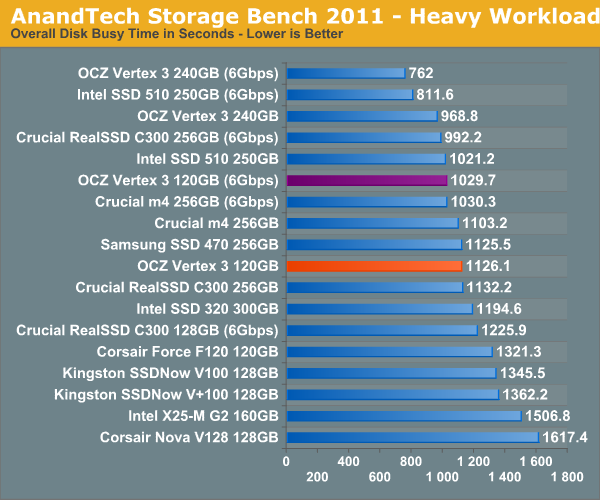
The next three charts just represent the same data, but in a different manner. Instead of looking at average data rate, we're looking at how long the disk was busy for during this entire test. Note that disk busy time excludes any and all idles, this is just how long the SSD was busy doing something:


153 Comments
View All Comments
dagamer34 - Wednesday, April 6, 2011 - link
Any idea when these are going to ship out into the wild? I've got a 120GB Vertex 2 in my 2011 MacBook Pro that I'd love to stick into my Windows 7 HTPC so it's more responsive.Ethaniel - Wednesday, April 6, 2011 - link
I just love how Anand puts OCZ on the grill here. It seems they'll just have to step it up. I was expecting some huge numbers coming from the Vertex 3. So far, meh.softdrinkviking - Wednesday, April 6, 2011 - link
"OCZ insists that there's no difference between the Spectek stuff and standard Micron 25nm NAND"Except for the fact that Spectek is 34nm I am assuming?
There surely must be some significant difference in performance between 25 and 34, right?
softdrinkviking - Wednesday, April 6, 2011 - link
sorry, i think that wasn't clear.what i mean is that it seems like you are saying the difference in process nodes is purely related to capacity, but isn't there some performance advantage to going lower as well?
softdrinkviking - Wednesday, April 6, 2011 - link
okay. forget it. i looked back through and found the part where you write about the 25nm being slower.that's weird and backwards. i wonder why it gets slower as it get smaller, when cpus are supposedly going to get faster as the process gets smaller?
are their any semiconductor engineers reading this article who know?
are the fabs making some obvious choice which trades in performance at a reduced node for cost benefits, in an attempt to increase die capacities and lower end-user costs?
lunan - Thursday, April 7, 2011 - link
i think because the chip get larger but IO interface to the controller remain the same (the inner raid). instead of addressing 4GB of NAND, now one block may consists of 8GB or 16GB NAND.in case of 8 interface,
4x8GB =32GB NAND but 8x8GB=64GB NAND, 8x16GB=128GB NAND
the smaller the shrink is, the bigger the nand, but i think they still have 8 IO interface to the controller, hence the time takes also increased with every shrinkage.
CPU or GPU is quite different because they implement different IO controller. the base architecture actually changes to accommodate process shrink.
they should change the base architecture with every NAND if they wish to archive the same speed throughput, or add a second controller....
I think....i may not be right >_<
lunan - Thursday, April 7, 2011 - link
for example the vertex 3 have 8GB NAND with 16(8 front and 8 back) connection to the controller. now imagine if the NAND is 16GB or 32 GB and the interface is only 16 with 1 controller?maybe the CPU approach can be done to this problem. if you wish to duplicate performace and storage, you do dual core (which is 1 cpu core beside the other)....
again...maybe....
softdrinkviking - Friday, April 8, 2011 - link
thanks for your reply. when i read it, i didn't realize that those figures were referring to the capacity of the die.as soon as i re-read it, i also had the same reaction about redesigning the controller, it seems the obvious thing to do,
so i can't believe that the controller manufacturer's haven't thought of it.
there must be something holding them back, probably $$.
the major SSD players all appear to be trying to pull down the costs of drives to encourage widespread adoption.
perhaps this is being done at the expense of obvious performance increases?
Ammaross - Thursday, April 7, 2011 - link
I think if you re-reread (yes, twice), you'll note that with the die shrink, the block size was upped from 4K to 8K. This is twice the space to be programmed or erased per write. This is where the speed performance disappears, regardless of the number of dies in the drive.Anand Lal Shimpi - Wednesday, April 6, 2011 - link
Sorry I meant Micron 34nm NAND. Corrected :)Take care,
Anand