The OCZ Vertex 3 Review (120GB)
by Anand Lal Shimpi on April 6, 2011 6:32 PM ESTAnandTech Storage Bench 2011
I didn't expect to have to debut this so soon, but I've been working on updated benchmarks for 2011. Last year we introduced our AnandTech Storage Bench, a suite of benchmarks that took traces of real OS/application usage and played them back in a repeatable manner. I assembled the traces myself out of frustration with the majority of what we have today in terms of SSD benchmarks.
Although the AnandTech Storage Bench tests did a good job of characterizing SSD performance, they weren't stressful enough. All of the tests performed less than 10GB of reads/writes and typically involved only 4GB of writes specifically. That's not even enough exceed the spare area on most SSDs. Most canned SSD benchmarks don't even come close to writing a single gigabyte of data, but that doesn't mean that simply writing 4GB is acceptable.
Originally I kept the benchmarks short enough that they wouldn't be a burden to run (~30 minutes) but long enough that they were representative of what a power user might do with their system.
Not too long ago I tweeted that I had created what I referred to as the Mother of All SSD Benchmarks (MOASB). Rather than only writing 4GB of data to the drive, this benchmark writes 106.32GB. It's the load you'd put on a drive after nearly two weeks of constant usage. And it takes a *long* time to run.
I'll be sharing the full details of the benchmark in some upcoming SSD articles but here are some details:
1) The MOASB, officially called AnandTech Storage Bench 2011 - Heavy Workload, mainly focuses on the times when your I/O activity is the highest. There is a lot of downloading and application installing that happens during the course of this test. My thinking was that it's during application installs, file copies, downloading and multitasking with all of this that you can really notice performance differences between drives.
2) I tried to cover as many bases as possible with the software I incorporated into this test. There's a lot of photo editing in Photoshop, HTML editing in Dreamweaver, web browsing, game playing/level loading (Starcraft II & WoW are both a part of the test) as well as general use stuff (application installing, virus scanning). I included a large amount of email downloading, document creation and editing as well. To top it all off I even use Visual Studio 2008 to build Chromium during the test.
Update: As promised, some more details about our Heavy Workload for 2011.
The test has 2,168,893 read operations and 1,783,447 write operations. The IO breakdown is as follows:
| AnandTech Storage Bench 2011 - Heavy Workload IO Breakdown | ||||
| IO Size | % of Total | |||
| 4KB | 28% | |||
| 16KB | 10% | |||
| 32KB | 10% | |||
| 64KB | 4% | |||
Only 42% of all operations are sequential, the rest range from pseudo to fully random (with most falling in the pseudo-random category). Average queue depth is 4.625 IOs, with 59% of operations taking place in an IO queue of 1.
Many of you have asked for a better way to really characterize performance. Simply looking at IOPS doesn't really say much. As a result I'm going to be presenting Storage Bench 2011 data in a slightly different way. We'll have performance represented as Average MB/s, with higher numbers being better. At the same time I'll be reporting how long the SSD was busy while running this test. These disk busy graphs will show you exactly how much time was shaved off by using a faster drive vs. a slower one during the course of this test. Finally, I will also break out performance into reads, writes and combined. The reason I do this is to help balance out the fact that this test is unusually write intensive, which can often hide the benefits of a drive with good read performance.
There's also a new light workload for 2011. This is a far more reasonable, typical every day use case benchmark. Lots of web browsing, photo editing (but with a greater focus on photo consumption), video playback as well as some application installs and gaming. This test isn't nearly as write intensive as the MOASB but it's still multiple times more write intensive than what we were running last year.
As always I don't believe that these two benchmarks alone are enough to characterize the performance of a drive, but hopefully along with the rest of our tests they will help provide a better idea.
The testbed for Storage Bench 2011 has changed as well. We're now using a Sandy Bridge platform with full 6Gbps support for these tests. All of the older tests are still run on our X58 platform.
AnandTech Storage Bench 2011 - Heavy Workload
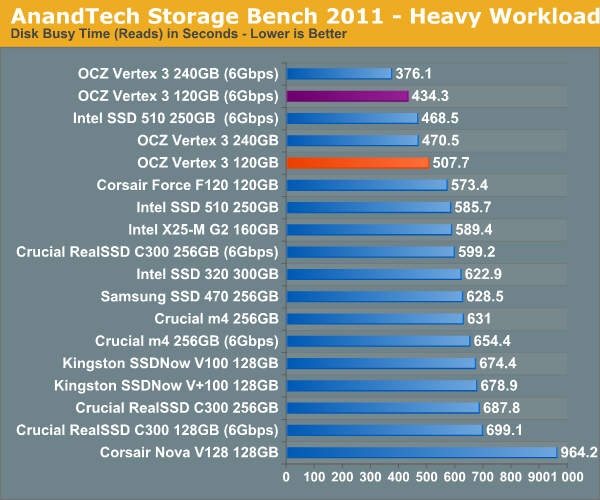
We'll start out by looking at average data rate throughout our new heavy workload test:
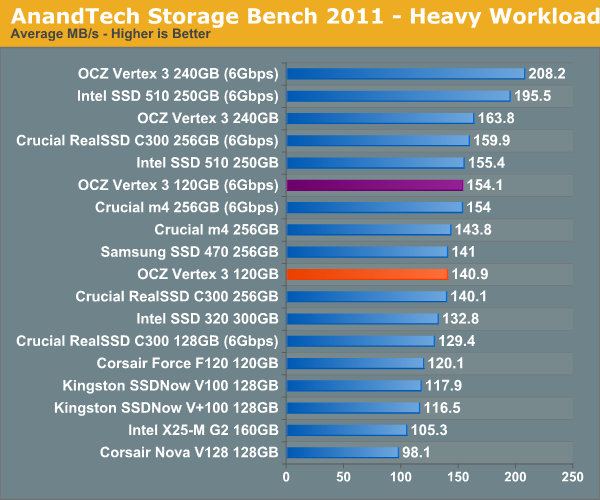
In our heavy test for 2011 the 120GB Vertex 3 is noticeably slower than the 240GB sample we tested a couple of months ago. Fewer available die are the primary explanation. We're still waiting on samples of the 120GB Intel SSD 320 and the Crucial m4 but it's looking like this round will be more competitive than we originally thought.
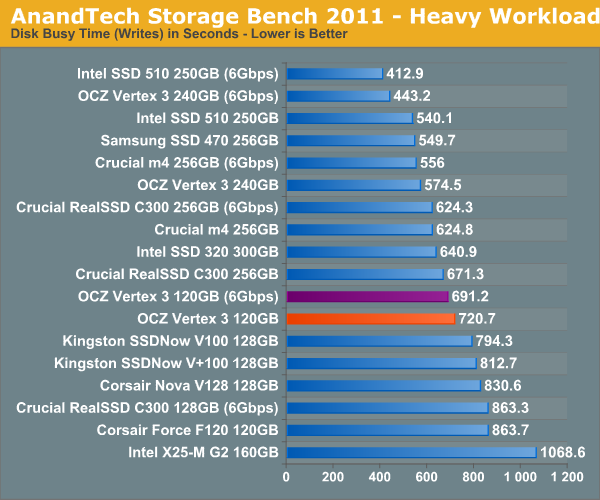
The breakdown of reads vs. writes tells us more of what's going on:
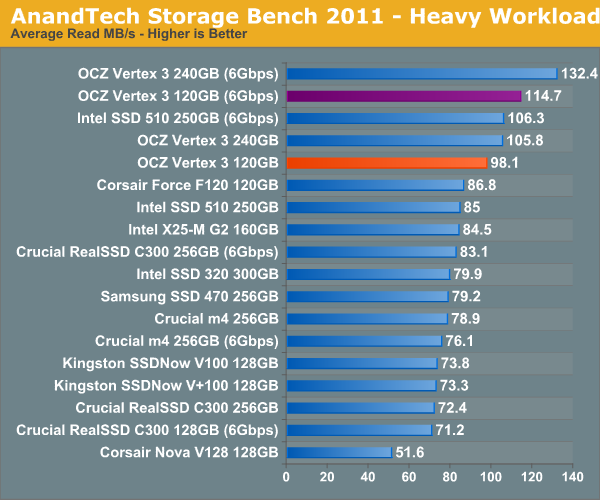
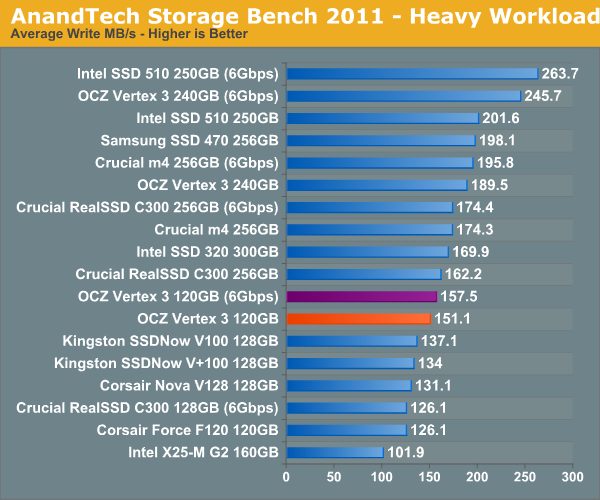
Surprisingly enough it's not read speed that holds the 120GB Vertex 3 back, it's ultimately the lower (incompressible) write speed:
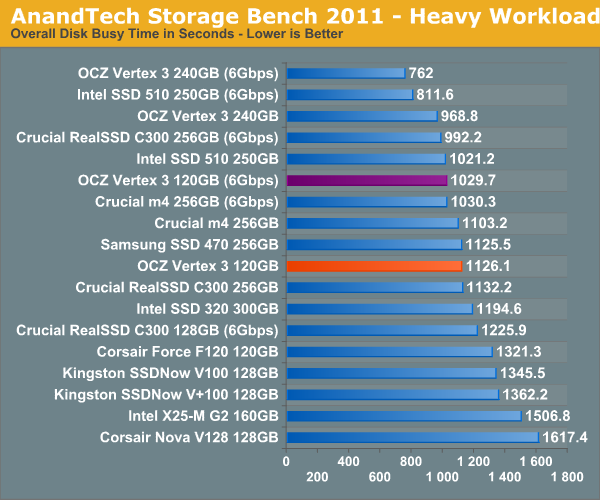
The next three charts just represent the same data, but in a different manner. Instead of looking at average data rate, we're looking at how long the disk was busy for during this entire test. Note that disk busy time excludes any and all idles, this is just how long the SSD was busy doing something:


153 Comments
View All Comments
GrizzledYoungMan - Thursday, April 7, 2011 - link
Thank you Anand for your vigilance and consumer advocacy. OCZ's disorganization remains a problem for their customers (and I'm one of them, running OCZ SSDs in all my systems).Still, I am disappointed by the fact that your benchmarks continue to exaggerate the different between SSDs, instead of realistically portraying the difference between SSDs that a user might notice in daily operation. Follow my thinking:
1. The main goal of buy an SSD, or upgrading an SSD from another SSD, is to improve system responsiveness as it appears to the user.
2. No user particularly cares about the raw performance of their drives as much as how much performance is really available in real-world use.
3. Thus, tests should focus on timing and comparing common operations, in both solo tasking and multi tasking scenarios (like booting, application loading, large catalog/edit files/database loading and manipulation for heavy duty desktop content creation applications and so on).
4. In particular, Sandforce is a huge concern when comparing benchmarks to real world use. Sure, they kill in the benchmarks everyone uses, but many of the most resource intensive (and especially disk intensive) desktop tasks are content creation related (photo and video, primarily) which use incompressible files. How is it that no one has investigated the performance of Sandforce in these situations?
Users here have complained that if we did only #3, only a small difference between SSDs would be apparent. But to my eyes, THAT IS EXACTLY WHAT WE NEED TO KNOW. If the performance delta between generations of SSDs is not really significant, and the price isn't moving, then this is a problem for the industry and consumers alike.
However, creating the perception with unrealistically heavy trace programs that SSDs have significant performance differences (or that different flash types and processes have significant performance differences) when you haven't yet demonstrated that there are real world performance differences in terms of system responsiveness (if anything, you've admitted the opposite on a few occasions) strikes me as a well intentioned but ultimately irresponsible testing method.
I'm sure it's exciting to stick it to OCZ. But really, they are one manufacturer among many, and not the core issue. The core issue is this charade we're all participating in, in which we pretend to understand how SSDs really improve the user experience when we have barely scratched the surface of this issue (or are even heading in the wrong direction).
GrizzledYoungMan - Thursday, April 7, 2011 - link
Wow, typos galore there. Too early, too much going on, too little coffee. Sorry.kmmatney - Thursday, April 7, 2011 - link
The Anand Storage Bench 2010 "Typical workload" is about as close as you can get (IMO) to a real work test. Maybe its a heavier multitasking scenario that most of us would use, but I think its the best test out there to give a real-world assessment of SSDs. Just read the description of the test - I think it already has what you are asking for:"The first in our benchmark suite is a light/typical usage case. The Windows 7 system is loaded with Firefox, Office 2007 and Adobe Reader among other applications. With Firefox we browse web pages like Facebook, AnandTech, Digg and other sites. Outlook is also running and we use it to check emails, create and send a message with a PDF attachment. Adobe Reader is used to view some PDFs. Excel 2007 is used to create a spreadsheet, graphs and save the document. The same goes for Word 2007. We open and step through a presentation in PowerPoint 2007 received as an email attachment before saving it to the desktop. Finally we watch a bit of a Firefly episode in Windows Media Player 11."
GrizzledYoungMan - Friday, April 8, 2011 - link
Actually, the storage bench is the opposite of what I'm asking for. I've written about this a couple of times, but my complaint is basically that benchmarks exaggerate the difference between SSDs, that in real world use, it might be impossible to tell one apart from another.The Anand Storage Benches might be the worst offenders in this regard, since they dutifully exaggerate the difference between SSD generations while giving the appearance of a highly precise way to test "real world" workloads.
In particular, the Sandforce architecture is an area of concern. Sure, it blows away everyone in the benchmarks, but the fact that it becomes HDD-slow when given an incompressible workload really has to be explored further. After all, the most disk-intensive desktop workloads all involve manipulating highly compressed (ie, not compressible further) image files, video files and to a lesser degree audio files. One more than one occasion, I've seen people use Sandforce drives as scratch disks for this sort of thing (given their high sequential writes, it would seem ideal) and been deeply disappointed by the resulting performance.
No response yet from Anand on this. But I'll keep posting. It's nothing personal - if anything, I'm posting here out of respect for Anand's leadership in testing.
KenPC - Thursday, April 7, 2011 - link
Nice write up. And - excellent results getting OCZ to grow up a little bit more.As a consumer, the solution of SKU's based on NAND will be confusing and complicated. How the heck am I supposed to know if the xxx.34 or the xxx.25 or some future xxxx.Hyn34 or xxxx.IMFT25 is the one that will meet one of the many performance levels offered?
A complicating factor that you mentioned in the article, is that for a specific manufacturer and process size, there can be varying levels of NAND performance.
I strongly urge you to consider working with OCZ to 'bin' the drives with establshed benchmarks that focus on BOTH random and TRUE non-conmpressible data rates. SKU suffixes then describe the binned performance.
You also have the opportunity to help set SSD 'industry standard benchmarks' here!
Then give OCZ the license to meet those binned performance levels with the best/lowest cost methods they can establish.
But until OCZ comes up with some 'assured performance level', OCZ is just off of my SSD map.
KenPC
KenPC - Thursday, April 7, 2011 - link
Yes, a reply to my own post......But how about a unique and novel idea?
What if.. a Vertex 2 is a Vertex 2 is a Vertex 2, as measured by ALL of the '4 pillars' of SSD performance?
Vertex 3's are Vertex 3's, and so on......
If different nand/fw/controller results in any of the parameters 'out of spec', then that version never ships as a 'Vertex 2'.
After all, varying levels of performance is why there is a vertex, a vertex 2, and an onyx and an agility, and an onyx2, and an agility2, and etc etc within the OCZ SSD line.
Why should the consumer need to have to look a second tier of detail to know the product performance?
KenPC
strikeback03 - Friday, April 8, 2011 - link
So any time Sandforce/OCZ upgrades the firmware you need a new product name? If something happened in the IMFT process and they had to buy up Samsung NAND instead, new product? And of course everyone wants to wait for reviews of the new drives before buying.I personally don't mind them changing stuff as necessary so long as they maintain some minimum performance that they advertise. The real-world benchmarks in the Storage Review articles showed a 2-5% difference, to me that is within margin of error and not a problem for anyone not benchmarking for fun. The Hynix NAND performing at only ~70% of the old ones are a problem, not so much the 25nm ones.
semo - Thursday, April 7, 2011 - link
You've done well. I hope you continue to do this kind of work as it benefits the general public and in this particular case, keeps the bad PR away from a very promising technology.The OCZ Core and other jmicron drives did plenty to slow down the progress of SSD adoption in to the mainstream. You caught the problem earlier than anyone else and fixed it. This time around it took you longer because of other high priority projects. I think your detective and lobbying work are what keeps us techies checking AT daily. In my opinion, the Vertex 2 section of this article deserves home page space and a catchy title!
Finally, let's not forget that OCZ have not yet fixed this issue. People may still have 25nm drives without knowing it or be capable of understanding the problems. OCZ must issue a recall of all mislabeled drives.
Shadowmaster625 - Thursday, April 7, 2011 - link
It is ridiculous to expect a company to release so many SKUs based on varying NAND types. It costs a company big money to release and keep track of all those SKUs. When you look at the actual real world differences between the different NAND types, it only comes down to a few percentage points of difference. It is like comparing different types of motherboard RAM. It is a waste of time and money to even bother looking at one vs another. OCZ should just tell you all to go pound sand. I suspect they will eventually, if you keep nitpicking like this. The 25nm Vertex 2 is virtually identical to the 34nm version. If you run a complete battery of real world and synthetic tests, you clearly see that they are within a few % of each other. There is no reason for OCZ to waste any more time or money trying to placate a nitpicking nerd mob.semo - Thursday, April 7, 2011 - link
The real issue was that it wasn't just a few % difference. Some V2 drives were nowhere near the rated capacity with the 25nm NAND. So if you bought 2 V2 drives and they happen to be different versions, RAID wouldn't work. There is still no way to confirm if the V2 you are trying to buy is one of the affected drives as OCZ haven't issued a recall or taken out affected drives from retail shelves. Best way to avoid unnecesary hassle is not to buy OCZ at all. Corsair did a much better job at informing the customer about the transition:http://www.corsair.com/blog/force25nm/
The performance difference was higher than a few % as well.