The MacBook Pro Review (13 & 15-inch): 2011 Brings Sandy Bridge
by Anand Lal Shimpi, Brian Klug & Vivek Gowri on March 10, 2011 4:17 PM EST- Posted in
- Laptops
- Mac
- Apple
- Intel
- MacBook Pro
- Sandy Bridge
Thermals and Power Consumption
The new MacBook Pros have the potential to draw more power than the previous generation. Despite being built on a 32nm process, the new 15 has twice the cores of last year's model—there's no question that it can draw more power under a full load.
I measured maximum power consumption at the wall using the same power brick and a fully charged battery. I chose two high-load scenarios: Cinebench 11.5 and Half Life 2. The former will fully load all CPU cores while the latter ramps up CPU and GPU usage.
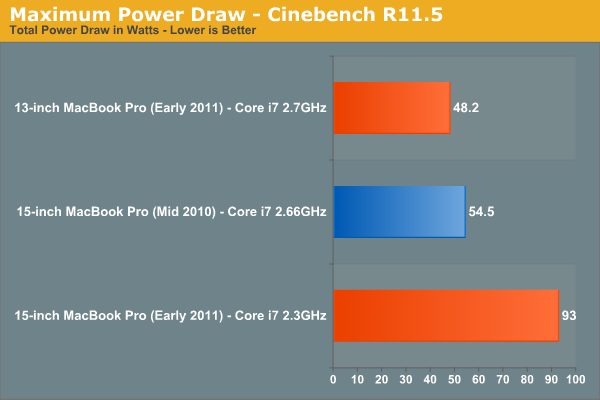
Under Cinebench the new quad-core 15-inch MacBook Pro draws 70% more power at the wall than last year's dual-core model. This shouldn't be surprising as Cinebench scales nearly perfectly with core count—twice the cores should result in nearly twice the power draw. The scaling isn't perfect since we are dealing with different architectures and a number of factors such as display remain static. The new 13-inch MacBook Pro isn't as worrisome, it has 88% of the power usage of the high end 2010 15-inch MBP and 81% of the battery capacity.
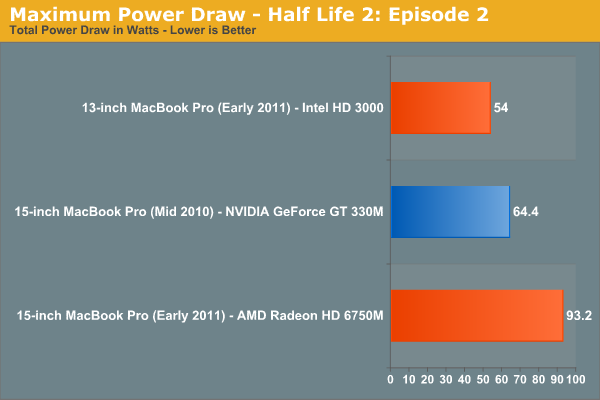
The Half Life 2 comparison is not quite as bad, although the new 15-inch MBP still uses 45% more power under full load compared to the previous generation. These numbers tell you one thing: although the new MBP is significantly faster than its predecessor, it can also draw significantly more power. Running the same workload the new MBP shouldn't have any problems lasting as long as the old MBP on battery, but running a more aggressive workload will result in shorter battery life as a result of the higher max power consumption. In other words if you use the higher performance to do more, you can expect your battery to last proportionally less than the 2010 MBP.
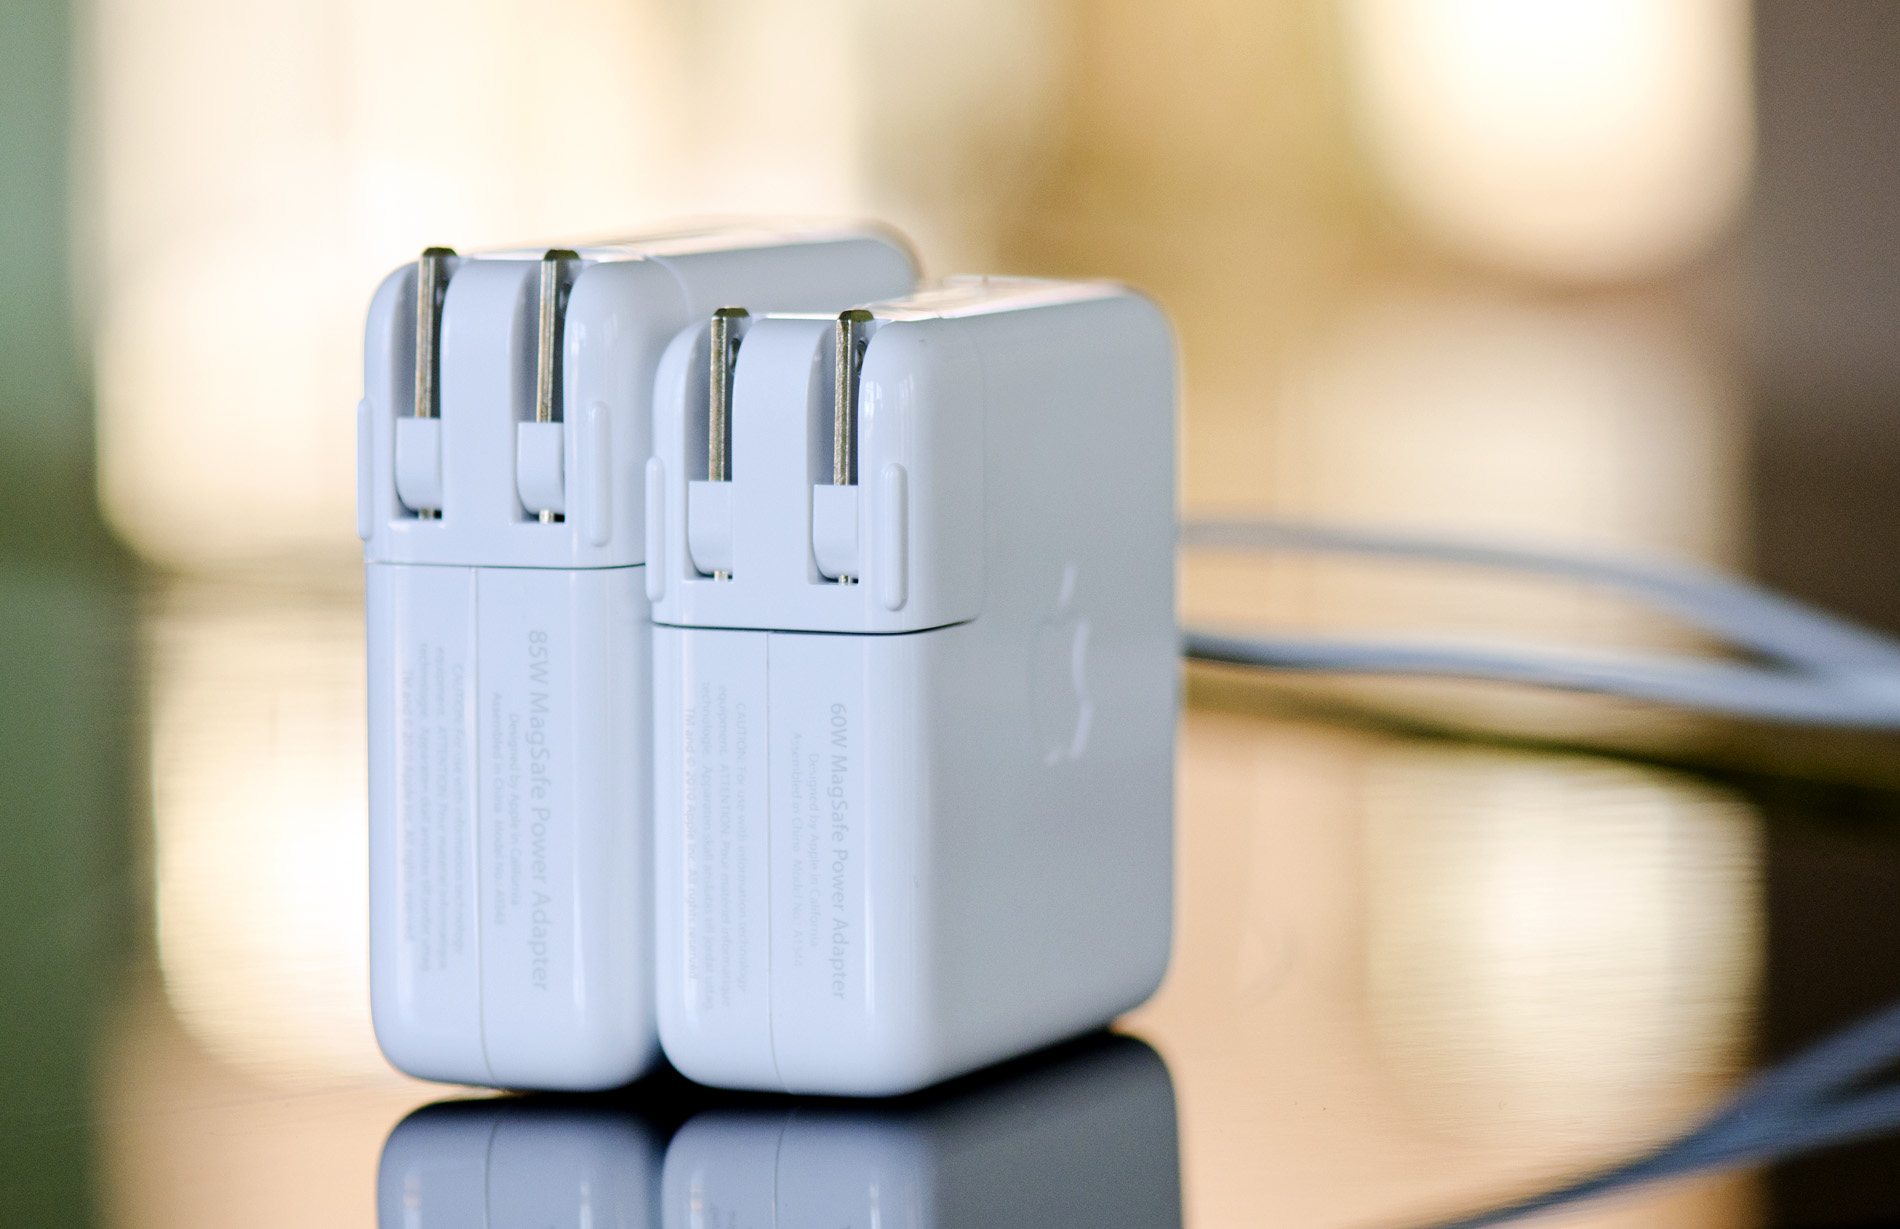
The 15-inch MBP uses an 85W power adapter (left) and the 13-inch MBP uses a 60W adapter (right)
Drawing more power also has another unfortunate side effect: the bottom of the chassis gets even hotter than before. I took some crude temperature measurements when I did the 2010 MacBook Pro reviews last year. I pointed an IR thermometer at the center of the bottom of the notebook, right where you'd have your lap, and measured surface temperature in a couple of scenarios.
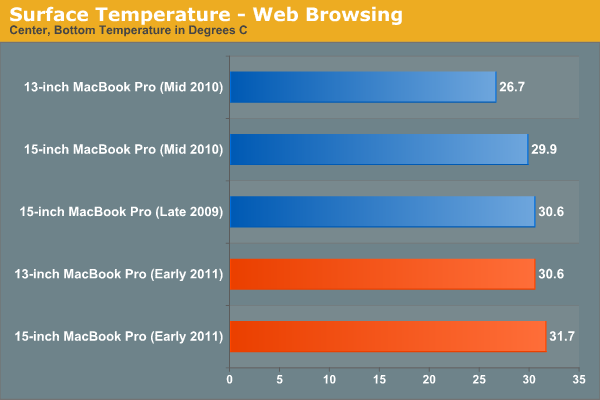
While browsing the web with tons of windows/tabs open I noticed a small but tangible increase in surface temperature of the 2011 15-inch MBP compared to the 2010 model. Even the new 13 is warmer than last year's 15. Under light workloads none of these temperatures are high enough to really be a problem.
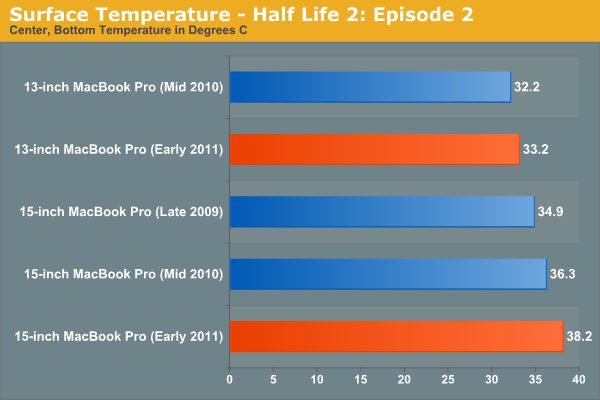
Load up the system however and you start getting into the uncomfortable zone. The new 15 breaks 38C, while the new 13 is actually only marginally warmer than the old 13 thanks to the use of Intel's HD Graphics 3000.
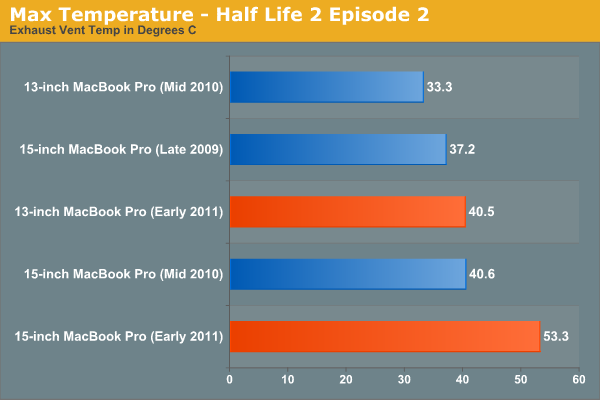
The biggest difference I noticed was the max temperature near the exhaust fan(s) on the notebooks. The new 15 is a whole 13C warmer than last year's model.
There's no way to get around it—if you're going to be using these systems to anywhere near their potential, they are going to get significantly warmer than last year's. Also, as a result, the new systems are noisier. Fans are more likely to spin up and given how small they are, they are quite audible. If this is a deal breaker for you, the best advice I can give you is to wait for Ivy Bridge.
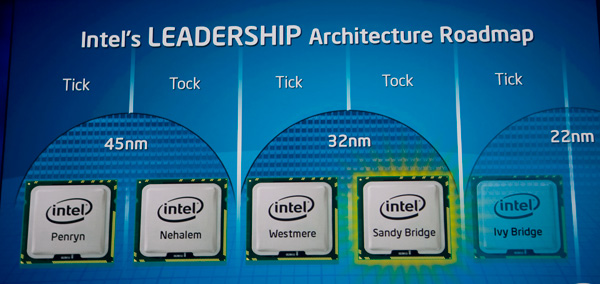
Ivy Bridge will bring mild updates to the Sandy Bridge architecture, an increase in performance but more importantly it'll bring Intel's 22nm process. At 22nm I'd expect somewhat lower power usage than what we're seeing here today. Ivy Bridge is expected to ship in the first half of 2012, with updated MacBook Pros arriving ~2 months post introduction.


198 Comments
View All Comments
zhill - Friday, March 11, 2011 - link
Hmm... so I mostly disagree, but the fact that there is some confusion is problematic as well.I assumed (the need to assume is the problematic part) that the main battery life tests (Web loads, etc) were run with OSX doing whatever it wants. The point of the gfxCardStatus tests was to specifically point out the difference in power consumption with each card being used. The only way to expose that behavior explicitly is to manually enable/disable the dGPU.
So, I think the methodology makes sense, but I agree that Anand should make it clear in the general battery-life section that OSX is managing the GPU in stock form with no gfxCardStatus inferference.
7Enigma - Friday, March 11, 2011 - link
I ran the numbers. The values (in minutes) that were reported in the 1st and 3rd charts of page 15 which correspond to the light and Flash-based web surfing are dead on the bottom of page 9 numbers where the discrete GPU has been TURNED OFF.It is so bad that after running the numbers if you were to use the data from page 9 the 15" MacBook Pro would be so far in last place on the Flash-based chart (at 177minutes) that the next highest is over an hour and a half LONGER.
zhill - Friday, March 11, 2011 - link
I believe he's using Safari in the web and flash web tests, and mentions:"Another contributing factor is the new 32nm iGPU which is active full-time under Safari. " When discussing the Flash problem (on pg 9) he specifically mentions Chrome + Flash activating the dGPU.
So, the question is: what is the dGPU behavior for other browsers? Do Firefox and Safari only use the iGPU or is the dGPU activation only in Chrome? It needs to be addressed in the article more fully for no other reason than clarity and so users will know that choice of browser may impact battery life very significantly.
7Enigma - Friday, March 11, 2011 - link
That is a good point (missed the Chrome/Safari switch), but it is also puzzling that the numbers from both charts match up perfectly. I would have expected a bit of difference between Chrome and Safari even if the dGPU issue is taken away just due to coding differences, but if you divide the minutes by 60 from the earlier page you'll get the EXACT same number of hours posted in the later battery numbers. The only way to describe this without it being the same number would be if they are comparing numbers from 2 different browsers in the same chart without labeling as such which I find very hard to believe.7Enigma - Saturday, March 12, 2011 - link
Seriously not a single reply from one of the authors?IlllI - Friday, March 11, 2011 - link
theres hardly much difference between the 13in model and the 17in. so basically you are paying $1000 more for 4 inches.alent1234 - Friday, March 11, 2011 - link
i5 to i7, discrete GPU, more hard drive spacealmost same price difference if you went with dell/hp
khimera2000 - Friday, March 11, 2011 - link
Just so you know looking at the recommended configuration of hp envy cost 1932, a maxed out 3D vision dell xps 17 cost about 2480 but has a sell that brings it down to 2244 (dual HDD no SDD) where as the base configuration of the mac cost 2500. so..,. no even if you throw in the discreet, I7 increased harddrive space your still over the mark when you compare to windows notebooks.How did i find these numbers? opened up the web sight for each respective company and looked at what they had as of 5:00 PM 3/11/2011 applicable to US customers (after all they where the US versions of the sight) except for dell no others where offering an automatic discounts.
jed22281 - Friday, March 11, 2011 - link
Should've done the 13" and then jumped up to the 17".Is there some reason you're not interested in the 17" versus the 15"?
Thanks!
jed22281 - Saturday, March 12, 2011 - link
Anand, Brian, or Vivek?Thanks!